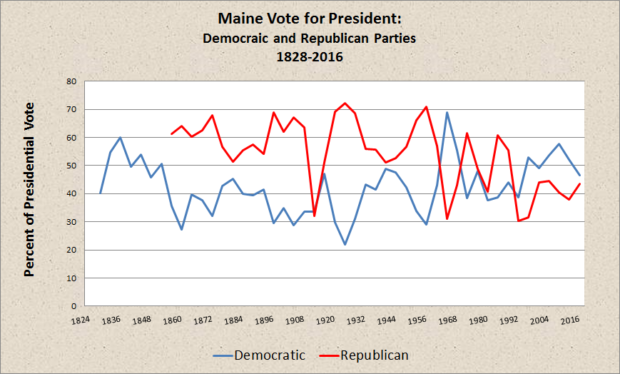
Here are the results of presidential elections in Maine since 1824. Party abbreviations under “Other”: SL=Socialist Labor; C=Communist; SLC=Socialist Labor and Communist (totals combined); ND=National Democrat; IND=Independence; ST=Single Tax.
The various early “parties” came and went rather frequently in the nineteenth century. Some were simply vehicles for individuals or specific causes.
| Number | Percent | Number | Percent | John Adams | Crawford | Number | Percent | Other | ||||
| 1824 | Democratic | National Republican | 10,289 | 81.50 | 2,336 | 18.50 | Number | Percent | ||||
| 1828 | 13,927 | 40.14 | 20,773 | 59.86 | Anti-Masonic | |||||||
| 1832 | 33,984 | 54.68 | 27,327 | 43.97 | Whig | 841 | 1.35 | |||||
| 1836 | 22,900 | 60.04 | Liberty | 15,239 | 39.96 | |||||||
| 1840 | 46,190 | 49.67 | 186 | 0.20 | 46,612 | 50.13 | ||||||
| 1844 | 45,964 | 53.79 | 4,862 | 5.69 | 34,619 | 40.52 | Free Soil | |||||
| 1848 | 40,138 | 45.85 | 35,279 | 40.30 | 12,124 | 13.85 | ||||||
| 1852 | 41,609 | 50.63 | Republican | 32,543 | 39.60 | 8,030 | 9.77 | |||||
| 1856 | 39,080 | 35.60 | 67,379 | 61.37 | 3,325 | 3.03 | Breckinridge | Const. Union | ||||
| 1860 | 26,693 | 27.26 | 62,811 | 64.15 | 6,368 | 6.50 | 2,046 | 2.09 | ||||
| 1864 | 47,736 | 39.78 | 72,278 | 60.22 | ||||||||
| 1868 | 42,396 | 37.58 | 70,426 | 62.42 | ||||||||
| 1872 | 29,087 | 32.14 | 61,422 | 67.86 | Greenback | |||||||
| 1876 | 49,914 | 42.71 | 66,300 | 56.73 | 662 | 0.57 | Prohibition | American | ||||
| 1880 | 65,171 | 45.28 | 74,056 | 51.45 | 4,480 | 3.11 | 93 | 0.06 | 142 | 0.10 | ||
| 1884 | 52,140 | 39.97 | 72,209 | 55.35 | 3,953 | 3.03 | 2,160 | 1.66 | Union Labor | |||
| 1888 | 50,481 | 39.36 | 73,734 | 57.49 | Populist | 2,691 | 2.10 | 1344 | 1.05 | Other | ||
| 1892 | 48,044 | 41.39 | 62,931 | 54.21 | 2,045 | 1.76 | 3,062 | 2.64 | SL 336 | .29 | ||
| 1896 | 34,587 | 29.65 | 80,461 | 68.98 | 1,589 | 1.36 | Socialist | ND1867 | 1.58 | |||
| 1900 | 36,823 | 34.83 | 65,435 | 61.89 | 2,585 | 2.45 | 878 | 0.83 | ||||
| 1904 | 27648 | 28.79 | 64438 | 67.10 | 338 | 0.35 | 1,510 | 1.57 | 2,103 | 2.19 | ||
| 1908 | 35,403 | 33.51 | 66,987 | 63.41 | T. Roosevelt | 1,487 | 1.41 | 1,758 | 1.66 | IND 701 | .66 | |
| 1912 | 51,113 | 33.72 | 48,495 | 31.99 | 48,495 | 31.99 | 946 | 0.62 | 2,541 | 1.68 | ||
| 1916 | 64,033 | 46.97 | 69,508 | 50.99 | 597 | 0.44 | 2,177 | 1.60 | ||||
| 1920 | 58,961 | 29.85 | 136,355 | 69.03 | LaFollette | 1 | 0 | 2,214 | 1.12 | ST 310 | .16 | |
| 1924 | 41,964 | 21.88 | 138,440 | 72.18 | 11,382 | 5.93 | SL 406 | .21 | ||||
| 1928 | 81,179 | 30.96 | 179,923 | 68.63 | 1,068 | 0.41 | ||||||
| 1932 | 128,907 | 43.25 | 166,631 | 55.91 | Union | 2,489 | 0.84 | SLC 417 | .14 | |||
| 1936 | 126,333 | 41.58 | 168,823 | 55.56 | 7,581 | 2.49 | 334 | 0.11 | 783 | 0.26 | SLC 386 | .13 |
| 1940 | 156,478 | 48.83 | 163,951 | 51.17 | C 411 | .13 | ||||||
| 1944 | 140,631 | 47.50 | 155,434 | 52.50 | H. Wallace | SL 335 | .11 | |||||
| 1948 | 111,916 | 42.30 | 150,234 | 56.78 | 1,884 | 0.71 | 547 | 0.21 | SL 206 | .08 | ||
| 1952 | 118,806 | 33.79 | 232,353 | 66.08 | 332 | 0.09 | 138 | 0.04 | SL 156 | .04 | ||
| 1956 | 102,468 | 29.13 | 249,238 | 70.87 | ||||||||
| 1960 | 181,159 | 42.95 | 240,608 | 57.05 | ||||||||
| 1964 | 262,264 | 68.84 | 118,701 | 31.16 | G. Wallace | |||||||
| 1968 | 217,312 | 55.30 | 169,254 | 43.07 | 6,370 | 1.62 | ||||||
| 1972 | 160,584 | 38.51 | 256,458 | 61.49 | E. McCarthy | Ben Bubar | ||||||
| 1976 | 232,279 | 48.09 | 236,320 | 48.93 | 10,874 | 2.25 | 3,495 | 0.72 | John Anderson | |||
| 1980 | 220,974 | 37.68 | 238,522 | 40.67 | 63,515 | 10.83 | 53,327 | 9.09 | 10,188 | 1.74 | ||
| 1984 | 214,515 | 38.78 | 336,500 | 60.83 | 2,129 | 0.38 | ||||||
| 1988 | 243,569 | 43.88 | 307,131 | 55.34 | Perot/Reform | Libertarian | 4,335 | 0.78 | ||||
| 1992 | 263,420 | 38.77 | 206,504 | 30.39 | 206,820 | 30.44 | 1,681 | 0.25 | Greens | 1,074 | 0.16 | |
| 1996 | 312,788 | 52.82 | 186,378 | 31.47 | 85,970 | 14.52 | 2,996 | 0.51 | 1,579 | 0.27 | 2,486 | 0.42 |
| 2000 | 319,951 | 49.09 | 286,616 | 43.97 | 4,443 | 0.68 | 3,074 | 0.47 | 37,127 | 5.70 | 606 | 0.09 |
| 2004 | 396,842 | 53.57 | 330,201 | 44.58 | 1,963 | 0.3 | 2,936 | 0.40 | 8,808 | 1.19 | ||
| 2008 | 421,923 | 57.71 | 295,273 | 40.38 | 2,900 | 0.40 | 11,067 | 1.51 | ||||
| 2012 | 401,306 | 52.14 | 292,276 | 37.98 | 9,352 | 1.22 | 8,119 | 1.05 | 11,760 | |||
| 2016 | 357,735 | 46.48 | 335,593 | 43.60 | 38,105 | 4.95 | 14,251 | 1.85 | 26,208 | |||
Additional resources
Maine. Department of Secretary of State. Bureau of Corporations and Elections. http://www.state.me.us/sos/cec/elec/results/index.html


