The distribution of people by age varies among the sixteen counties.
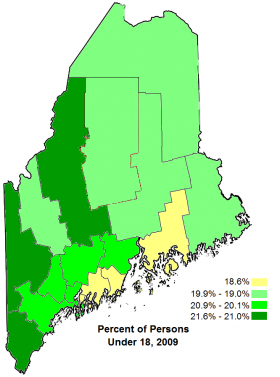
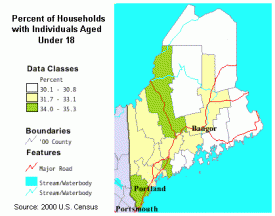 Census reports for 2009 show young people under 18 years of age form a greater portion of the populations in western and southern counties. Three mid-coast counties (Lincoln, Knox and Hancock) have the fewest young people, with the northern and eastern counties also having relatively few people under the age of 18. These reports are similar to that in the 2000 U.S. Census depicted in its map above right.
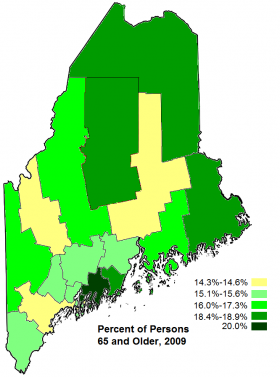
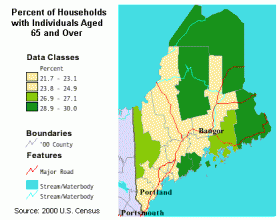 Older Mainers (65 and above), in contrast, tend to form a greater portion of the populations of northern and eastern counties, with the exceptions of Penobscot County in east central Maine, and in Lincoln County in the mid-coast. Again, the pattern is similar to the 2000 U.S. Census report.
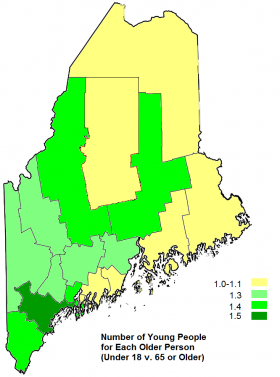 Another way to view these age relationships, is to compate the ratio of younder to older peole in each county. The accompanying map on the right illustrates the number of children under 18 for each person 65 or older.
The northern and eastern counties, with the exception of Penobscot, show a virtually equal balance between younger and older people. The three southernmost coastal counties, Yoyk, Cumberland, and Sagadahoc, along with Penobscot and Somerset, report the highest portion of young people to older people.
One constant in all three 2009 figures is the grouping of the sparsely populated counties of Piscataquis, Aroostook, and Washington.
Source: U.S. Census, People QuickFacts 2010 at http://quickfacts.census.gov/qfd/states/23000.html (accessed August 31, 2011)

