")
Digging clams on the flats (2004)
While softshell clam landings by commercial fishermen are down from their peaks in the 1970’s and early 1980’s, the total value and price per pound have increased dramatically. Some of the limits on clam harvests are a result of periodic closures of clam flats by the Maine Department of Marine Resources. Public health and water quality are the prime factors in the closures.
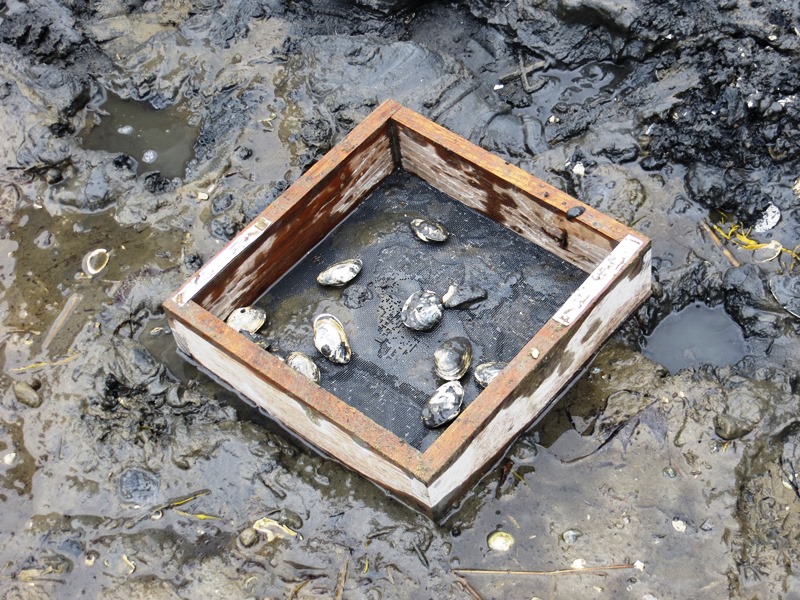
Clam survey on a tidal flat
Another threat are invasive species. According to the Maine Department of Marine Resources, “Maine’s most destructive and costly invader has been the green crab which arrived in the eastern U.S. in the mid-1800s via ballast water from vessels from Europe and significantly diminished the soft-shell clam resource.”
The list of top ten towns in terms of pounds of clams harvested has varied. In the five-year period 2007-2011, the following towns have been in the top ten each year: Brunswick, Deer Isle, Freeport, Machiasport, Scarborough, St. George, and Waldoboro. Harpswell missed only 2010. Addison, Cushing, Damariscotta, and Swans Island were occasional listings. Click to enlarge all charts.


As harvests have declined, then stabilized, the price per pound has increased, more than tripling since 1982.

Softshell Clam Landings 1950-2016

Softshell Clams Prices 1950-2016
| YEAR | POUNDS | POUNDS (millions) |
VALUE | PRICE/LB |
| 1950 | 33,696,810 | 33.7 | $1,184,370 | $0.04 |
| 1951 | 25,090,940 | 25.1 | $1,186,937 | $0.05 |
| 1952 | 27,060,740 | 27.1 | $1,673,347 | $0.06 |
| 1953 | 20,325,200 | 20.3 | $1,382,161 | $0.07 |
| 1954 | 18,237,310 | 18.2 | $1,360,436 | $0.07 |
| 1955 | 12,845,350 | 12.8 | $948,592 | $0.07 |
| 1956 | 10,917,690 | 10.9 | $808,035 | $0.07 |
| 1957 | 9,622,130 | 9.6 | $737,518 | $0.08 |
| 1958 | 8,006,600 | 8.0 | $599,633 | $0.07 |
| 1959 | 7,107,940 | 7.1 | $547,789 | $0.08 |
| 1960 | 10,160,150 | 10.2 | $822,810 | $0.08 |
| 1961 | 9,038,050 | 9.0 | $793,590 | $0.09 |
| 1962 | 9,706,410 | 9.7 | $894,395 | $0.09 |
| 1963 | 8,974,840 | 9.0 | $786,765 | $0.09 |
| 1964 | 8,670,643 | 8.7 | $814,652 | $0.09 |
| 1965 | 9,622,718 | 9.6 | $963,671 | $0.10 |
| 1966 | 14,740,195 | 14.7 | $1,387,246 | $0.09 |
| 1967 | 15,563,424 | 15.6 | $1,478,777 | $0.10 |
| 1968 | 16,326,717 | 16.3 | $1,388,102 | $0.09 |
| 1969 | 20,261,098 | 20.3 | $1,752,149 | $0.09 |
| 1970 | 25,766,880 | 25.8 | $2,497,362 | $0.10 |
| 1971 | 25,724,339 | 25.8 | $2,694,244 | $0.10 |
| 1972 | 30,094,869 | 30.1 | $3,708,573 | $0.12 |
| 1973 | 33,082,830 | 33.1 | $5,264,899 | $0.16 |
| 1974 | 28,926,724 | 28.9 | $4,510,771 | $0.16 |
| 1975 | 32,081,461 | 32.1 | $5,692,252 | $0.18 |
| 1976 | 36,104,655 | 36.1 | $7,489,339 | $0.21 |
| 1977 | 38,391,657 | 38.4 | $9,271,544 | $0.24 |
| 1978 | 29,435,447 | 29.4 | $7,469,611 | $0.25 |
| 1979 | 25,447,234 | 25.4 | $7,507,899 | $0.30 |
| 1980 | 27,703,924 | 27.7 | $8,518,278 | $0.31 |
| 1981 | 25,428,638 | 25.4 | $8,409,568 | $0.33 |
| 1982 | 20,857,693 | 20.9 | $6,394,045 | $0.31 |
| 1983 | 20,315,341 | 20.3 | $7,249,306 | $0.36 |
| 1984 | 25,511,924 | 25.5 | $11,606,099 | $0.45 |
| 1985 | 23,295,683 | 23.3 | $12,132,260 | $0.52 |
| 1986 | 18,501,596 | 18.5 | $11,046,789 | $0.60 |
| 1987 | 13,213,036 | 13.2 | $8,214,291 | $0.62 |
| 1988 | 11,324,473 | 11.3 | $7,423,976 | $0.66 |
| 1989 | 12,332,962 | 12.3 | $8,437,650 | $0.68 |
| 1990 | 12,318,086 | 12.3 | $8,850,690 | $0.72 |
| 1991 | 7,242,180 | 7.2 | $4,784,092 | $0.66 |
| 1992 | 11,101,401 | 11.1 | $7,862,425 | $0.71 |
| 1993 | 11,299,439 | 11.3 | $9,158,238 | $0.81 |
| 1994 | 9,891,508 | 9.9 | $8,817,991 | $0.89 |
| 1995 | 9,145,943 | 9.1 | $7,940,748 | $0.87 |
| 1996 | 7,628,281 | 7.6 | $5,408,920 | $0.71 |
| 1997 | 8,619,860 | 8.6 | $7,325,092 | $0.85 |
| 1998 | 11,536,041 | 11.5 | $10,082,059 | $0.87 |
| 1999 | 11,181,594 | 11.2 | $10,465,211 | $0.94 |
| 2000 | 11,193,217 | 11.2 | $9,545,531 | $0.85 |
| 2001 | 13,031,932 | 13.0 | $16,609,083 | $1.27 |
| 2002 | 11,875,072 | 11.9 | $14,369,771 | $1.21 |
| 2003 | 11,584,281 | 11.6 | $15,859,272 | $1.37 |
| 2004 | 11,661,647 | 11.7 | $16,627,775 | $1.43 |
| 2005 | 9,099,746 | 9.1 | $14,080,692 | $1.55 |
| 2006 | 9,608,285 | 9.6 | $13,775,038 | $1.43 |
| 2007 | 9,109,558 | 9.1 | $12,574,283 | $1.38 |
| 2008 | 9,768,308 | 9.8 | $12,824,057 | $1.31 |
| 2009 | 9,306,958 | 9.3 | $11,686,086 | $1.26 |
| 2010 | 10,211,009 | 10.2 | $13,044,773 | $1.28 |
| 2011 | 11,587,233 | 11.5 | $15,850,931 | $1.37 |
| 2012 | 11,081,155 | 11.1 | $15,693,501 | $1.42 |
| 2013 | 11,250,760 | 11.3 | $18,102,437 | $1.61 |
| 2014 | 10,182,821 | 10.2 | $20,231,500 | $1.99 |
| 2015 | 9,267,736 | 9.3 | $22,844,626 | $2.49 |
| 2016 | 7,348,557 | 7.3 | $15,656,386 | $2.13 |
Additional resources
Maine. Department of Marine Resources. “Non-Native Invasive Marine Species.” http://www.maine.gov/dmr/rm/invasives/index.htm (accessed February 27, 2011) The most recent data years are preliminary and subject to revision.