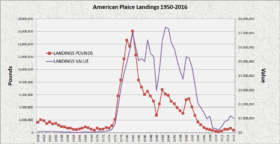
American Plaice had modest landings by commercial fishermen of one to two million pounds from 1950 through 1976. It then jumped to six million per year that, with a few exceptions, was the minimum landing amount until 1995. It then began to slip, again with a few exeptions, until landngs hit a six decade low at 142,036 pounds.
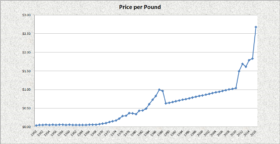
As usual, a shortage of this species has led to increasing price per pound numbers.
| YEAR | POUNDS | VALUE | PRICE/LB | |
| 1950 | 1,613,700 | $60,385 | $0.04 | |
| 1951 | 2,019,500 | $100,900 | $0.05 | |
| 1952 | 1,866,000 | $96,926 | $0.05 | |
| 1953 | 1,413,500 | $81,537 | $0.06 | |
| 1954 | 1,654,100 | $89,629 | $0.05 | |
| 1955 | 1,386,400 | $84,455 | $0.06 | |
| 1956 | 1,448,200 | $75,287 | $0.05 | |
| 1957 | 1,152,400 | $65,333 | $0.06 | |
| 1958 | 968,400 | $62,279 | $0.06 | |
| 1959 | 870,800 | $45,269 | $0.05 | |
| 1960 | 711,100 | $40,845 | $0.06 | |
| 1961 | 688,500 | $32,881 | $0.05 | |
| 1962 | 515,800 | $24,867 | $0.05 | |
| 1963 | 454,600 | $21,992 | $0.05 | |
| 1964 | 572,703 | $26,270 | $0.05 | |
| 1965 | 718,953 | $34,753 | $0.05 | |
| 1966 | 870,086 | $47,936 | $0.06 | |
| 1967 | 753,075 | $45,872 | $0.06 | |
| 1968 | 560,531 | $31,627 | $0.06 | |
| 1969 | 353,928 | $23,445 | $0.07 | |
| 1970 | 721,256 | $64,119 | $0.09 | |
| 1971 | 509,631 | $48,701 | $0.10 | |
| 1972 | 526,817 | $67,083 | $0.13 | |
| 1973 | 770,415 | $112,628 | $0.15 | |
| 1974 | 721,810 | $124,186 | $0.17 | |
| 1975 | 1,083,578 | $243,459 | $0.22 | |
| 1976 | 2,055,967 | $606,331 | $0.29 | |
| 1977 | 5,819,200 | $1,765,599 | $0.30 | |
| 1978 | 8,338,002 | $3,123,725 | $0.37 | |
| 1979 | 11,644,502 | $4,172,117 | $0.36 | |
| 1980 | 14,633,889 | $4,943,565 | $0.34 | |
| 1981 | 13,616,540 | $5,853,803 | $0.43 | |
| 1982 | 16,032,135 | $7,037,494 | $0.44 | |
| 1983 | 12,244,414 | $5,971,663 | $0.49 | |
| 1984 | 8,295,110 | $5,059,507 | $0.61 | |
| 1985 | 7,182,743 | $5,216,387 | $0.73 | |
| 1986 | 6,024,720 | $4,998,675 | $0.83 | |
| 1987 | 6,508,738 | $6,516,725 | $1.00 | |
| 1988 | 5,795,825 | $5,585,425 | $0.96 | |
| 1989 | 4,969,719 | $5,332,464 | $1.07 | |
| 1990 | 2,754,265 | $2,960,902 | $1.08 | |
| 1991 | 4,499,218 | $4,382,925 | $0.97 | |
| 1992 | 6,777,604 | $6,477,655 | $0.96 | |
| 1993 | 6,084,917 | $7,414,640 | $1.22 | |
| 1994 | 5,875,137 | $7,300,627 | $1.24 | |
| 1995 | 4,946,581 | $6,346,767 | $1.28 | |
| 1996 | 4,556,522 | $5,883,221 | $1.29 | |
| 1997 | 3,929,218 | $5,035,257 | $1.28 | |
| 1998 | 3,423,150 | $4,338,900 | $1.27 | |
| 1999 | 3,017,709 | $3,763,362 | $1.25 | |
| 2000 | 5,187,014 | $5,338,494 | $1.03 | |
| 2001 | 5,363,105 | $5,223,611 | $0.97 | |
| 2002 | 4,080,193 | $4,622,074 | $1.13 | |
| 2003 | 2,684,184 | $3,297,418 | $1.23 | |
| 2004 | 1,646,476 | $2,037,788 | $1.24 | |
| 2005 | 1,240,775 | $1,747,374 | $1.41 | |
| 2006 | 783,591 | $1,383,477 | $1.77 | |
| 2007 | 584,119 | $983,258 | $1.68 | |
| 2006 | 784,021 | $1,384,132 | $1.77 | |
| 2007 | 584,051 | $982,776 | $1.68 | |
| 2008 | 453,522 | $1,158,830 | $2.56 | |
| 2009 | 323,322 | $329,728 | $1.02 | |
| 2010 | 194,423 | $282,846 | $1.45 | |
| 2011 | 142,036 | $211,495 | $1.49 | |
| 2012 | 254,636 | $429,252 | $1.69 | |
| 2013 | 484,159 | $779,015 | $1.61 | |
| 2014 | 487,782 | $873,494 | $1.79 | |
| 2015 | 647,027 | $1,181,142 | $1.83 | |
| 2016 | 370,038 | $990,057 | $2.68 |
Source: http://www.maine.gov/dmr/commercialfishing/documents/plaice.table_002.pdf (accessed January 25, 2018)


