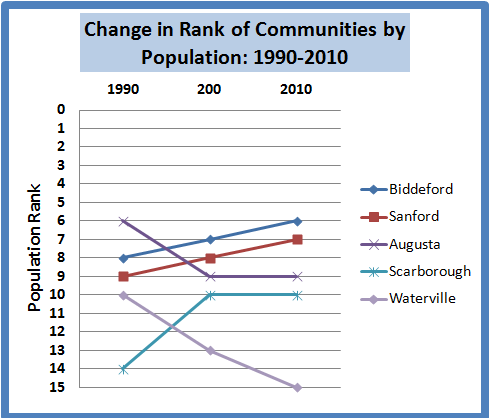
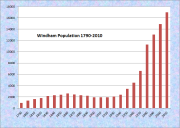
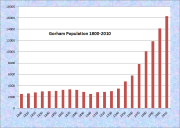
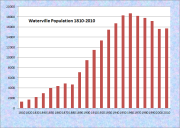
Fifteen communities had populations of over 15,000 in the year 2010, two more than in 2000. While ranks of the first five were little changed, Scarborough surged ahead while Waterville fell behind. Windham and Gorham were new to the list in 2010.
Among the fifteen, the fastest growing communities from 2000 to 2010 were suburbs of Portland: Scarborough 11.5%;, Windham 14.1%; and Gorham 15.8%. Only two of the fifteen lost population: Auburn 0.6%; and Brunswick 4.2%, mostly due to the closing of Brunswick Naval Air Station.
| Rank | Town | County | 1990 | 2000 | 2010 |
| 1, 1, 1 | Portland | Cumberland | 64,358 | 64,249 | 66,194 |
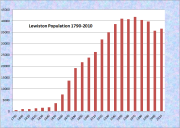
| 2, 2, 2 | Lewiston | Androscoggin | 39,757 | 35,690 | 36,592 |
| 3, 3, 3 | Bangor | Penobscot | 33,181 | 31,473 | 33,039 |
| 5, 4, 4 | South Portland | Cumberland | 23,163 | 23,324 | 25,002 |
| 4, 5, 5 | Auburn | Androscoggin | 24,039 | 23,203 | 23,055 |
| 8, 7, 6 | Biddeford | York | 20,710 | 20,942 | 21,277 |
| 9, 8, 7 | Sanford | York | 20,463 | 20,806 | 20,798 |
| 7, 6, 8 | Brunswick | Cumberland | 20,906 | 21,172 | 20,278 |
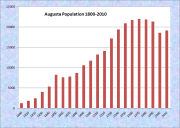
| 6, 9, 9 | Augusta | Kennebec | 21,325 | 18,560 | 19,136 |
| 14, 10, 10 | Scarborough | Cumberland | 12,518 | 16,970 | 18,919 |
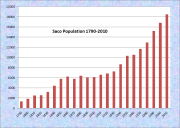
| 12, 11, 11 | Saco | York | 15,181 | 16,822 | 18,482 |
| 11, 12, 12 | Westbrook | Cumberland | 16,121 | 16,142 | 17,494 |
| 13, 14, 13 | Windham | Cumberland | 13,020 | 14,904 | 17,001 |
| 15, 15, 14 | Gorham | Cumberland | 11,856 | 14,141 | 16,381 |
| 10, 13, 15 | Waterville | Kennebec | 17,173 | 15,605 | 15,772 |
The “Rank” numbers refer to the population data reported in columns 1990, 2000, and 2010 respectively. Change in community rankings from 1990 to 2010 among those that moved two or more places is shown in the chart below. None in the top five, nor in the bottom five, moved that much. Thus, the chart depicts changes in the middle five of the fifteen communities with populations over 15,000.
Sources:
Decennial U.S. Census Reports.
Maine State Planning Office. Year 2000 Census Population Data. Spreadsheet. March 30, 2001.


