The U.S. Department of Education released a report November 26, 2012 “detailing state four-year high school graduation rates in 2010-11 – the first year for which all states used a common, rigorous measure.” The new calculation, the Department emphasized, is not comparable to previously reported rates.
Some news reports in Maine hailed the state’s ranking at 10th in the nation (not mentioning that it was actually tied with Illinois for that spot among the 47 states that reported).
The graduation rate, while important, is only one measure of educational success. (See also Rank of Maine, Education.) Were some states more lenient in graduating less prepared students? Were some states with higher standards, or more cautious about moving students with disabilities through their systems, rewarded with lower rankings?
For instance, Maine graduated 66% of students with disabilities, while New York’s rate for these students was 48%. What does this really mean?
Obviously evaluating our education systems is difficult, and Maine’s ranking should not be dismissed. But it should be a starting point for a comprehensive analysis.
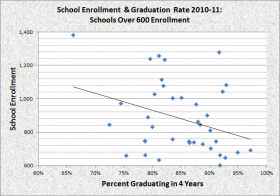
Within the state, as one might expect, wide differences may be found. For instance, Lewiston High School, the state’s largest, had a 4-year graduation rate of 66%. The next largest public high school, Bangor had a rate of 81%.
As the chart at right illustrates, for schools over 600 students, those at the smaller end of this range tend to have higher graduation rates. One reason may be that the larger schools are in large communities that attract families with English as a second language, or who have moved there for the social services they need but cannot get in smaller communities.
Smaller schools, under 600 enrollment, show little difference among themselves regarding size and graduation rates.
The graduation rate for all 133 public high schools was 83.15%; for the eleven 60% publicly funded private schools (eight “academies,” Maine Central Institute, John Bapst Memorial, Blue Hill Harbor), the rate was 91.8%.
Between 2011 and 2013 Maine dropped slightly in national rankings even as graduation rates improved from 84% to 86%. Given the often close percentage scores, small differences may result is large changes in ranking.
| Percent and Rank of All Students Graduating in 4 Years: 2011 and 2013 _____________________________ |
||||
| State | % | 2011 | % | 2013 |
| IOWA | 88% | 1 | 90% | 1 |
| VERMONT | 87% | 2 | 87% | 9 |
| WISCONSIN | 87% | 3 | 88% | 6 |
| INDIANA | 86% | 4 | 87% | 7 |
| NEBRASKA | 86% | 5 | 88% | 2 |
| NEW HAMPSHIRE | 86% | 6 | 87% | 8 |
| NORTH DAKOTA | 86% | 7 | 88% | 4 |
| TENNESSEE | 86% | 8 | 86% | 16 |
| TEXAS | 86% | 9 | 88% | 5 |
| ILLINOIS | 84% | 10 | 83% | 23 |
| MAINE | 84% | 11 | 86% | 13 |
| CONNECTICUT | 83% | 12 | 86% | 10 |
| KANSAS | 83% | 13 | 86% | 11 |
| MARYLAND | 83% | 14 | 85% | 18 |
| MASSACHUSETTS | 83% | 15 | 85% | 19 |
| NEW JERSEY | 83% | 16 | 88% | 3 |
| PENNSYLVANIA | 83% | 17 | 86% | 15 |
| SOUTH DAKOTA | 83% | 18 | 83% | 25 |
| MONTANA | 82% | 19 | 84% | 21 |
| VIRGINIA | 82% | 20 | 84% | 22 |
| ARKANSAS | 81% | 21 | 85% | 17 |
| MISSOURI | 81% | 22 | 86% | 14 |
| HAWAII | 80% | 23 | 82% | 27 |
| OHIO | 80% | 24 | 82% | 28 |
| WYOMING | 80% | 25 | 77% | 39 |
| ARIZONA | 78% | 26 | 75% | 43 |
| DELAWARE | 78% | 27 | 80% | 36 |
| NORTH CAROLINA | 78% | 28 | 83% | 24 |
| MINNESOTA | 77% | 29 | 80% | 33 |
| NEW YORK | 77% | 30 | 77% | 38 |
| RHODE ISLAND | 77% | 31 | 80% | 34 |
| CALIFORNIA | 76% | 32 | 80% | 31 |
| UTAH | 76% | 33 | 83% | 26 |
| WASHINGTON | 76% | 34 | 76% | 43 |
| WEST VIRGINIA | 76% | 35 | 81% | 29 |
| MISSISSIPPI | 75% | 36 | 76% | 41 |
| COLORADO | 74% | 37 | 77% | 36 |
| MICHIGAN | 74% | 38 | 77% | 37 |
| SOUTH CAROLINA | 74% | 39 | 78% | 35 |
| ALABAMA | 72% | 40 | 80% | 30 |
| FLORIDA | 71% | 41 | 76% | 40 |
| LOUISIANA | 71% | 42 | 74% | 44 |
| ALASKA | 68% | 43 | 72% | 45 |
| OREGON | 68% | 44 | 69% | 49 |
| GEORGIA | 67% | 45 | 72% | 46 |
| NEW MEXICO | 63% | 46 | 70% | 48 |
| NEVADA | 62% | 47 | 71% | 47 |
Additional resources
“2010-11 Four-Year Regulatory Adjusted Cohort Graduation Rates.” http://www.ed.gov/category/keyword/2010-11-four-year-regulatory-adjusted-cohort-graduation-rates (accessed December 1, 2012)
National Center for Education Statistics. “Public high school 4-year adjusted cohort graduation rate (ACGR) for the United States, the 50 states and the District of Columbia: School years 2010-11 to 2012-13” https://nces.ed.gov/ccd/tables/ACGR_2010-11_to_2012-13.asp#f2 (accessed June 2, 2017)
Maine high school data: http://www.maine.gov/education/gradrates/gradrates.html (accessed December 1, 2012)


