Compared to all other states and the District of Columbia, Maine ranks relatively high when considering the number of students per teacher and on the amount spent per pupil.
However, Maine ranks very low when comparing teacher salaries. It does rank fairly high in the percent of residents with high school or bachelor’s degrees, though that may reflect the high proportion of older and retired people in the state.
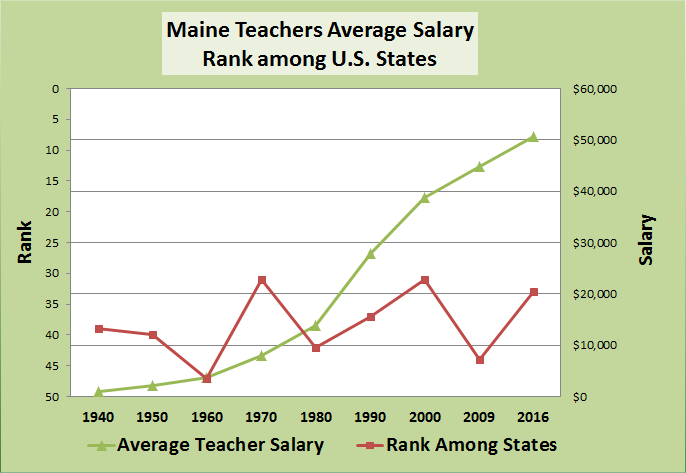
Average Maine Teacher Salaries
| Average Teacher Salaries | |||
| Year | Rank | Maine | U.S. |
| 1940 | 39 | $894 | $1,441 |
| 1950 | 40 | $2,115 | $3,010 |
| 1960 | 47 | $3,694 | $5,174 |
| 1970 | 31 | $8,059 | $9,047 |
| 1980 | 42 | $13,743 | $16,715 |
| 1990 | 37 | $27,831 | $32,638 |
| 2000 | 31 | $38,732 | $43,768 |
| 2009 | 44 | $44,700 | $54,300 |
| 2016* | 33 | $50,584 | $58,064 |
In the seventy years since 1940, Maine has never ranked higher than thirty-first compared to other states. The average for the period is 39th. Currently the average pay for teachers in Maine is 82 percent of that nationally. Maine’s average is the lowest among New England States, but higher than those in Mississippi and West Virginia.
![]()
| Per Pupil Expenditures | |||
| Year | Rank | Maine | U.S. |
| 1970 | 36 | $2,828 | $3,277 |
| 1980 | 40 | $3,586 | $4,426 |
| 1990 | 15 | $6,304 | $6,016 |
| 2000 | 14 | $6,828 | $6,508 |
| 2007 | 9 | $12,994 | $10,209 |
| 2009 | 7 | $14,576 | $10,905 |
Per pupil expenditures have increased dramatically, more than doubling from the year 2000 to 2009. As a result, the state is near the top among other states in this respect.
| Median Student/Teacher Ratios | |||
| Year | RANK | ME | US |
| Public Primary | |||
| 2001 | 7 | 13.4 | 16.0 |
| 2007 | 1 | 9.0 | 15.6 |
| Public Middle | |||
| 2001 | 13 | 14.1 | 15.5 |
| 2007 | 1 | 8.7 | 15.5 |
| Public High | |||
| 2001 | 17 | 13.9 | 14.8 |
| 2007 | 2 | 9.5 | 16.5 |
| All Public Schools | |||
| 2007 | 1 | 9.0 | 15.8 |
| 2012 | 4 | 12.2 | 16.0 |
| People 25+ Completing | |||
| Year | Rank | ME | US |
| High School or Higher | |||
| 1990 | 18 | 79% | 75% |
| 2000 | 12 | 85% | 80% |
| 2007 | 10 | 89% | 85% |
| 2010 | 11 | 85% | 80% |
| Bachelor’s Degree or More | |||
| 1990 | 29 | 19% | 20% |
| 2000 | 28 | 23% | 24% |
| 2007 | 20 | 27% | 28% |
| 2010 | 29 | 23% | 26% |
Maine has leaped to the top of the state rankings when it comes to the relatively small number of students per teacher in classrooms. By moving from over thirteen students per teacher, down to about nine per teacher, the state had become by 2007 the best in the nation on this measure.
When it comes to high school completion, Maine is marginally above the national averages and ranks relatively high. (See also Graduation Rates.) For those who have a basic college degree, the state is essentially on a par with the U.S. as a whole.
These completion numbers may not reflect the pool of people in the labor force, since the Maine has the oldest median age of any state at 42.7 years. After Florida at 17.3%, Maine has the largest proportion of its population aged 65 and older – 15.9%.
A more recent report of “How Maine Ranks” is available.
Additional resources
*”Teachers union open to talks on statewide contract concept.” Portland Press Herald. pp A1, A8. February 10, 2017. Citing data from Maine Education Association.
Age and Sex Composition: 2010, 2010 Census Briefs. http://www.census.gov/prod/cen2010/briefs/c2010br-03.pdf (accessed November 17, 2011)
The 2012 Statistical Abstract, The National Data Book. Education. http://www.census.gov/compendia/statab/cats/education.html (accessed November 17, 2011)
Median public school student/teacher ratio; 2007 data from http://nces.ed.gov/pubs2010/2010305/tables/table_04.asp, Table 4. Number of regular public elementary and secondary schools with membership and student/teacher ratio, by instructional level and state or jurisdiction: School year 2007–08
Average annual salary of instructional staff in public elementary and secondary schools (Alaska and Hawaii not included until 1960; California missing in 1950; 2007 data from http://www.census.gov/compendia/statab/cats/education/elementary_and_secondary_education_staff_and_finances.html, 253 – Public Elementary and Secondary Estimated Finances, and by State.)
Current expenditures per pupil in fall enrollment in public elementary and secondary schools in constant 1998-99 dollars (school year ending in noted year).
Completion of education levels: http://www.census.gov/compendia/statab/cats/education/educational_attainment.htm, Table 228. Educational Attainment by State. (accessed 9/27/2010)