Economic Data

Gross Domestic Product by County County by Rank $Billions GDP $Billions % of Total $ GDP People % Total People GDP /Capita Rank /Capita Rank/ Capita Per Capita GDP 1 Cumberland $19.40 34.04% 293,557 21.93% $88.45 Cumberland 1 $88.45 2 York $7.40 12.98% 206,229 15.41% $48.03 Hancock 2 $54.82 3 Penobscot $6.00 10.53% 151,096 11.29%…

Housing

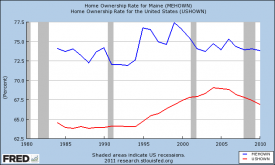
Chart Home Ownership Maine and US

Maine home ownership in 2010 was 73.8%, compared with 66.9% for the U.S. as a whole. It had dropped from 75.3% in 2006, just before the recession in the housing market. In 2000, the U.S. rate was 76.5 and Maine’s was 67.4.  From 1984 throught 2010, Maine’s peak rate of home ownership was 77.4% in…

Median Family Income

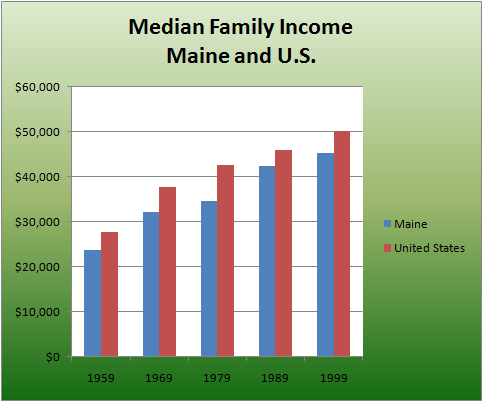
Median Family Income

The median income for families is that amount above which half the families have more and below which half the families have less income. It is “in the middle.” According to the U.S. Census: Family. A family is a group of two people or more (one of whom is the householder) related by birth, marriage,…

Median Household Income

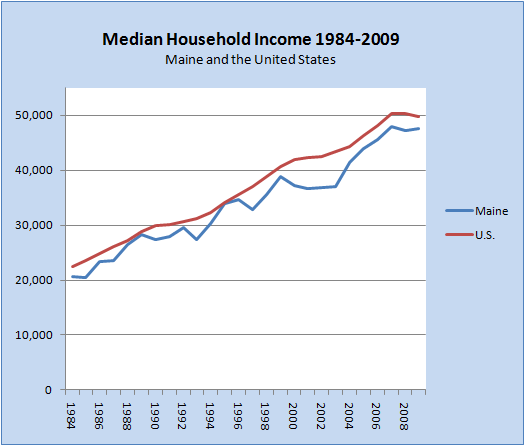
Household Income 1984-2009

The median income for a group is that amount above which half the group has more and below which half the group has less. It is “in the middle.” According to the U.S. Census: Family. A family is a group of two people or more (one of whom is the householder) related by birth, marriage,…

Median Value of Housing Units

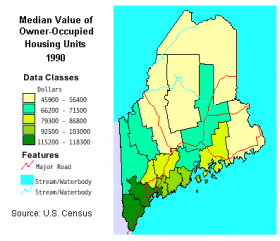
Map: Median Value of Housing Units 1990

The value of housing tells a lot about income and the competition for housing in a particular area. For nearly three decades the coastal counties (except for Washington) have registered higher housing values, while the northern counties and Washington County have had the lowest. During the 2005-2009 period, the distribuion has generally held to the…

Personal Income

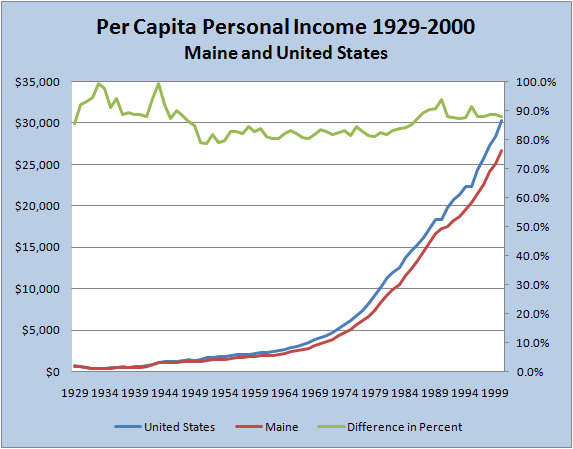
Personal Income Per Capita

Maine’s personal income per person (per capita) has lagged the national average by varying amounts since 1929.   The state’s percent of the national average (green line on the chart) has not strayed far from the long-term average of 86% durng the period. In the early 1930’s it exceeded 90% probably because the agricultural sector…

Poverty

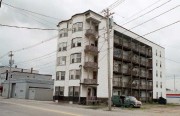
Tenement Housing Usually Serves Low-Income People (2002)

Official Poverty Levels by Family Size Size Income 1 $12,140 2 $16,460 3 $20,780 4 $25,100 5 $29,420 6 $33,740 7 $38,060 8 $42,380 – – – – – – – – – – For each additional family member, add $4,320. Standards for 2018 issued by the U.S. Department of Health and Human Services. The…

Vacant Housing Units

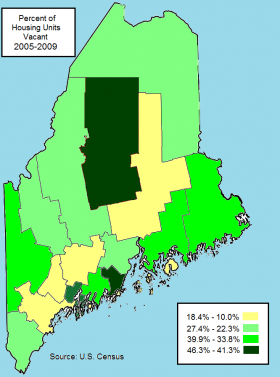
Map: Percent of Housing Units Vacant 2005-2009

During the period 2005 through 2009, housing unit vacancy rates varied widely from 10% in Androscoggin County to over 46% in Washington County.  This represents a slightly decreased disparity compared to the 2000 Census range for Maine, which was from 8.6% to 47.2%. Sources: Year 2000 map – http://factfinder.census.gov/servlet/ThematicMapFramesetServlet?-geo_id=04000US23&-tm_name=DEC_2000_SF1_U_M00200&-ds_name=DEC_2000_SF1_U 2005-2009 map: http://factfinder.census.gov/home/saff/main.html?_lang=en