Employment by Industry
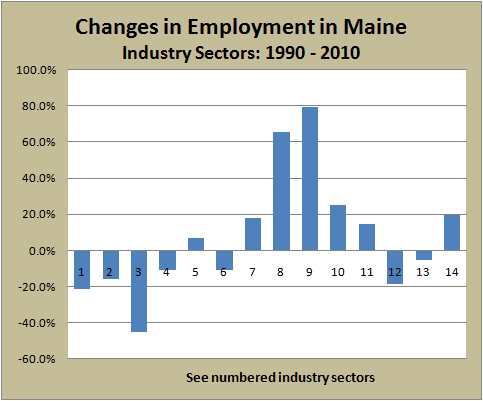
Change in Employment Sectors 1990-2010

In 1990 Trade (17.5%) and Manufacturing (17.4%) constituted the largest employment sectors in the Maine economy. By 2010, Manufacturing had faded to 8.6%, and the top two employment sectors were Trade (17%) and Education and Health Services (20.2%).  During the two decades, Manufacturing (No. 3 on the chart) had lost over 45% of its employees,…

Labor Force

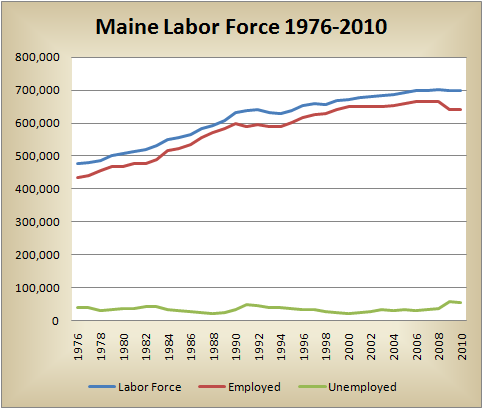
Chart of Maine Labor Force

The labor force is defined as the total of people employed and those who are unemployed and seeking employment. While growing in the long term, Maine’s total labor force actually contracts from time to time as people stop seeking employment. The recent rate of increase may be slowing as the population ages and in-migration of…

Economic Data

Gross Domestic Product by County County by Rank $Billions GDP $Billions % of Total $ GDP People % Total People GDP /Capita Rank /Capita Rank/ Capita Per Capita GDP 1 Cumberland $19.40 34.04% 293,557 21.93% $88.45 Cumberland 1 $88.45 2 York $7.40 12.98% 206,229 15.41% $48.03 Hancock 2 $54.82 3 Penobscot $6.00 10.53% 151,096 11.29%…