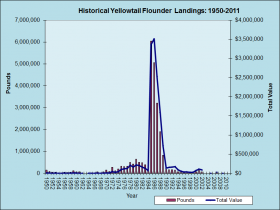
This species of the commercial fishery has a post-1950 history familiar to many others: moderate or low production, then a spike with several years of substantial landings, then a crash followed by a forced closure to rebuild the stock.
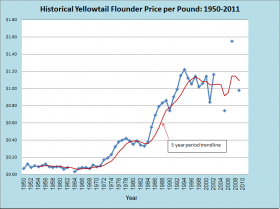
It appears that once the good landings created a wide market, the price per pound moved up, then continued to rise as availability declined.
Yellowtail flounder was not considered valuable until the mid-1930s, when winter flounder stocks declined. As demand for protein increased during World War II, more fishermen, both foreign and domestic, started fishing with otter trawls. The fishery soon expanded, especially in the Georges Bank and Southern New England/Mid-Atlantic areas. In the mid-1960s to mid-1970s annual harvests averaged 34,000 metric tons.
By the 1970s, Congress passed a law that phased out foreign fishing in U.S. waters, and harvest generally declined. However, years of heavy fishing had depleted the yellowtail stocks and they reached record lows in the 1980s. By the early 1990s, the Georges Bank and Southern New England/Mid-Atlantic stocks had collapsed. The Cape Cod/Gulf of Maine stock collapsed soon after.*
| YEAR | POUNDS | VALUE | PRICE/LB |
| 1950 | 145,300 | $10,839 | $0.07 |
| 1951 | 82,400 | $9,706 | $0.12 |
| 1952 | 55,100 | $4,563 | $0.08 |
| 1953 | 58,500 | $5,701 | $0.10 |
| 1954 | 23,700 | $2,202 | $0.09 |
| 1955 | 29,700 | $2,886 | $0.10 |
| 1956 | 51,700 | $6,266 | $0.12 |
| 1957 | 40,600 | $3,533 | $0.09 |
| 1958 | 64,300 | $5,357 | $0.08 |
| 1959 | 113,400 | $9,725 | $0.09 |
| 1960 | 65,300 | $5,986 | $0.09 |
| 1961 | 65,900 | $3,950 | $0.06 |
| 1962 | 17,300 | $1,369 | $0.08 |
| 1963 | |||
| 1964 | 5,410 | $156 | $0.03 |
| 1965 | 7,175 | $490 | $0.07 |
| 1966 | 21,800 | $1,723 | $0.08 |
| 1967 | 77,850 | $6,189 | $0.08 |
| 1968 | 13,040 | $915 | $0.07 |
| 1969 | 76,375 | $8,221 | $0.11 |
| 1970 | 155,067 | $13,317 | $0.09 |
| 1971 | 86,457 | $8,776 | $0.10 |
| 1972 | 276,449 | $47,546 | $0.17 |
| 1973 | 120,062 | $23,190 | $0.19 |
| 1974 | 197,082 | $45,079 | $0.23 |
| 1975 | 324,621 | $104,067 | $0.32 |
| 1976 | 314,450 | $120,892 | $0.38 |
| 1977 | 331,117 | $132,500 | $0.40 |
| 1978 | 509,436 | $212,639 | $0.42 |
| 1979 | 430,521 | $168,008 | $0.39 |
| 1980 | 644,713 | $223,110 | $0.35 |
| 1981 | 514,529 | $203,090 | $0.39 |
| 1982 | 485,800 | $164,991 | $0.34 |
| 1983 | 391,760 | $130,605 | $0.33 |
| 1984 | 187,346 | $70,322 | $0.38 |
| 1985 | 6,049,507 | $3,355,430 | $0.55 |
| 1986 | 5,067,254 | $3,511,123 | $0.69 |
| 1987 | 3,206,000 | $2,529,396 | $0.79 |
| 1988 | 1,909,927 | $1,591,535 | $0.83 |
| 1989 | 831,374 | $719,089 | $0.86 |
| 1990 | 186,255 | $137,320 | $0.74 |
| 1991 | 174,925 | $158,147 | $0.90 |
| 1992 | 163,457 | $162,028 | $0.99 |
| 1993 | 155,484 | $178,418 | $1.15 |
| 1994 | 73,267 | $89,309 | $1.22 |
| 1995 | 50,745 | $56,999 | $1.12 |
| 1996 | 33,225 | $34,767 | $1.05 |
| 1997 | 33,163 | $37,939 | $1.14 |
| 1998 | 30,036 | $30,510 | $1.02 |
| 1999 | 26,951 | $28,463 | $1.06 |
| 2000 | 67,590 | $77,311 | $1.14 |
| 2001 | 131,655 | $111,166 | $0.84 |
| 2002 | 76,455 | $88,992 | $1.16 |
| 2003 | |||
| 2004 | |||
| 2005 | 7,705 | $5,688 | $0.74 |
| 2006 | |||
| 2007 | 23,353 | $36,113 | $1.55 |
| 2008 | |||
| 2009 | 1,259 | $1,231 | $0.98 |
| 2010 | |||
| 2011 |
Source: http://www.maine.gov/dmr/commercial-fishing/landings/documents/yellowtail.table.pdf (accessed February 9, 2018)
*http://www.fishwatch.gov/seafood_profiles/species/flounder/species_pages/yellowtail_flounder.htm (accessed 9/27/12; slightly condensed and reformatted)


