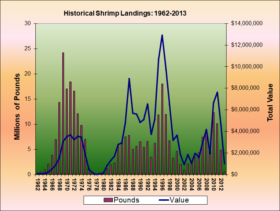
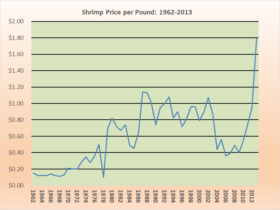
Despite an increasing tonnage of shrimp landings by commercial fishermen in recent years, the 2013 season will feature a landing quota equal to about 25% of the 2012 season’s landings. Historically the shrimp populations have varied substantially. Marine scientists believe that the resource is again under pressure with the threat of another population decline.
| YEAR | METRIC TONS | POUNDS | VALUE | PRICE/LB |
| 1962 | 159.53 | 351,700 | 51,513 | $0.15 |
| 1963 | 244.26 | 538,500 | 63,886 | $0.12 |
| 1964 | 419.42 | 924,667 | 111,626 | $0.12 |
| 1965 | 946.98 | 2,087,722 | 244,870 | $0.12 |
| 1966 | 1,737.81 | 3,831,207 | 541,669 | $0.14 |
| 1967 | 3,141.16 | 6,925,058 | 864,974 | $0.12 |
| 1968 | 6,515.07 | 14,363,251 | 1,589,973 | $0.11 |
| 1969 | 10,992.98 | 24,235,340 | 3,044,948 | $0.13 |
| 1970 | 7,712.82 | 17,003,828 | 3,511,198 | $0.21 |
| 1971 | 8,354.78 | 18,419,121 | 3,670,814 | $0.20 |
| 1972 | 7,515.57 | 16,568,982 | 3,231,997 | $0.20 |
| 1973 | 5,476.61 | 12,073,851 | 3,555,365 | $0.29 |
| 1974 | 4,431.93 | 9,770,732 | 3,465,764 | $0.35 |
| 1975 | 3,177.10 | 7,004,288 | 1,937,652 | $0.28 |
| 1976 | 617.18 | 1,360,650 | 487,812 | $0.36 |
| 1977 | 147.95 | 326,178 | 161,887 | $0.50 |
| 1978 | 0.06 | 125 | 12 | $0.10 |
| 1979 | 32.85 | 72,424 | 50,880 | $0.70 |
| 1980 | 69.59 | 153,419 | 126,096 | $0.82 |
| 1981 | 528.73 | 1,165,654 | 843,245 | $0.72 |
| 1982 | 883.01 | 1,946,696 | 1,301,828 | $0.67 |
| 1983 | 1,029.11 | 2,268,797 | 1,680,919 | $0.74 |
| 1984 | 2,564.71 | 5,654,203 | 2,783,600 | $0.49 |
| 1985 | 2,956.89 | 6,518,815 | 2,917,464 | $0.45 |
| 1986 | 3,407.26 | 7,511,716 | 4,801,995 | $0.64 |
| 1987 | 3,534.16 | 7,791,485 | 8,887,484 | $1.14 |
| 1988 | 2,272.34 | 5,009,646 | 5,677,376 | $1.13 |
| 1989 | 2,542.48 | 5,605,200 | 5,597,595 | $1.00 |
| 1990 | 2,962.05 | 6,530,201 | 4,828,693 | $0.74 |
| 1991 | 2,431.47 | 5,360,476 | 5,096,525 | $0.95 |
| 1992 | 2,973.29 | 6,554,976 | 6,540,444 | $1.00 |
| 1993 | 1,563.05 | 3,445,933 | 3,724,663 | $1.08 |
| 1994 | 2,815.41 | 6,206,899 | 5,104,039 | $0.82 |
| 1995 | 5,388.26 | 11,879,061 | 10,674,287 | $0.90 |
| 1996 | 8,163.35 | 17,997,092 | 12,925,540 | $0.72 |
| 1997 | 5,419.57 | 11,948,087 | 9,730,427 | $0.81 |
| 1998 | 3,050.01 | 6,724,113 | 6,450,877 | $0.96 |
| 1999 | 1,493.47 | 3,292,525 | 3,158,232 | $0.96 |
| 2000 | 2,086.59 | 4,600,149 | 3,649,982 | $0.79 |
| 2001 | 901.88 | 1,988,301 | 1,796,216 | $0.90 |
| 2002 | 383.73 | 845,984 | 906,446 | $1.07 |
| 2003 | 971.84 | 2,142,527 | 1,855,770 | $0.87 |
| 2004 | 1,053.76 | 2,323,147 | 1,002,427 | $0.43 |
| 2005 | 1,596.29 | 3,519,216 | 1,961,655 | $0.56 |
| 2006 | 1,912.99 | 4,217,415 | 1,512,001 | $0.36 |
| 2007 | 3,383.26 | 7,458,808 | 2,931,917 | $0.39 |
| 2008 | 3,851.81 | 8,491,782 | 4,166,412 | $0.49 |
| 2009 | 2,170.93 | 4,786,081 | 1,923,078 | $0.40 |
| 2010 | 5,566.54 | 12,272,114 | 6,660,005 | $0.54 |
| 2011 | 4,567.30 | 10,069,150 | 7,576,918 | $0.75 |
Source: http://www.maine.gov/dmr/commercial-fishing/landings/documents/shrimp.table.pdf (accessed February 5, 2018)


