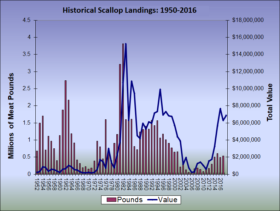
Scallop landing by commercial fishermen spiked in 1961 and in 1991, followed in each case by years of reduced landings.
Total value was low from 1950 through 1970, regardless of the volume of meat obtained. Since 1970 total value has generally followed the trend of the landings.
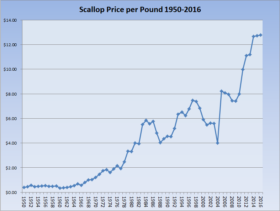
Price per pound has remained above $5.00 since 1992, except for 2004, and reached its peak of $12.77 in 2016.
| YEAR | MEAT POUNDS* | MEAT LBS (millions) | VALUE | PRICE/ POUND |
| 1950 | 524,800 | 0.5248 | $215,725 | $0.41 |
| 1951 | 676,800 | 0.6768 | $310,530 | $0.46 |
| 1952 | 1,495,800 | 1.4958 | $852,460 | $0.57 |
| 1953 | 1,697,200 | 1.6972 | $786,673 | $0.46 |
| 1954 | 707,700 | 0.7077 | $334,241 | $0.47 |
| 1955 | 1,113,600 | 1.1136 | $580,541 | $0.52 |
| 1956 | 969,900 | 0.9699 | $518,437 | $0.53 |
| 1957 | 745,300 | 0.7453 | $369,439 | $0.50 |
| 1958 | 393,900 | 0.3939 | $191,611 | $0.49 |
| 1959 | 1,133,500 | 1.1335 | $575,476 | $0.51 |
| 1960 | 1,875,300 | 1.8753 | $658,103 | $0.35 |
| 1961 | 2,740,100 | 2.7401 | $1,025,375 | $0.37 |
| 1962 | 2,169,400 | 2.1694 | $876,350 | $0.40 |
| 1963 | 1,186,000 | 1.186 | $547,923 | $0.46 |
| 1964 | 916,892 | 0.9169 | $501,752 | $0.55 |
| 1965 | 414,185 | 0.4142 | $288,570 | $0.70 |
| 1966 | 319,505 | 0.3195 | $181,155 | $0.57 |
| 1967 | 188,305 | 0.1883 | $150,511 | $0.80 |
| 1968 | 219,397 | 0.2194 | $217,345 | $0.99 |
| 1969 | 151,856 | 0.1519 | $154,913 | $1.02 |
| 1970 | 179,875 | 0.1799 | $215,875 | $1.20 |
| 1971 | 387,157 | 0.3872 | $563,859 | $1.46 |
| 1972 | 967,344 | 0.9673 | $1,705,110 | $1.76 |
| 1973 | 803,573 | 0.8036 | $1,472,120 | $1.83 |
| 1974 | 445,290 | 0.4453 | $722,672 | $1.62 |
| 1975 | 1,594,340 | 1.5943 | $3,020,035 | $1.89 |
| 1976 | 629,454 | 0.6295 | $1,351,808 | $2.15 |
| 1977 | 394,761 | 0.3948 | $754,823 | $1.91 |
| 1978 | 907,135 | 0.9071 | $2,243,066 | $2.47 |
| 1979 | 1,163,645 | 1.1636 | $3,878,413 | $3.33 |
| 1980 | 3,215,533 | 3.2155 | $10,685,857 | $3.32 |
| 1981 | 3,813,685 | 3.8137 | $15,245,802 | $4.00 |
| 1982 | 1,597,615 | 1.5976 | $6,295,185 | $3.94 |
| 1983 | 1,975,461 | 1.9755 | $10,881,368 | $5.51 |
| 1984 | 1,612,653 | 1.6127 | $9,436,604 | $5.85 |
| 1985 | 811,781 | 0.8118 | $4,523,790 | $5.57 |
| 1986 | 720,959 | 0.721 | $4,160,510 | $5.77 |
| 1987 | 1,238,912 | 1.2389 | $5,950,167 | $4.80 |
| 1988 | 1,310,735 | 1.3107 | $5,285,634 | $4.03 |
| 1989 | 1,403,527 | 1.4035 | $6,109,926 | $4.35 |
| 1990 | 1,315,773 | 1.3158 | $5,977,003 | $4.54 |
| 1991 | 1,579,577 | 1.5796 | $7,145,576 | $4.52 |
| 1992 | 1,419,839 | 1.4198 | $7,344,691 | $5.17 |
| 1993 | 1,566,321 | 1.5663 | $9,928,679 | $6.34 |
| 1994 | 1,063,608 | 1.0636 | $6,929,624 | $6.52 |
| 1995 | 1,177,506 | 1.1775 | $7,323,742 | $6.22 |
| 1996 | 1,008,329 | 1.0083 | $6,830,362 | $6.77 |
| 1997 | 905,137 | 0.9051 | $6,760,856 | $7.47 |
| 1998 | 771,471 | 0.7715 | $5,689,669 | $7.38 |
| 1999 | 641,692 | 0.6417 | $4,374,908 | $6.82 |
| 2000 | 658,568 | 0.6586 | $3,883,690 | $5.90 |
| 2001 | 211,558 | 0.2116 | $1,159,421 | $5.48 |
| 2002 | 348,470 | 0.3485 | $1,959,314 | $5.62 |
| 2003 | 131,849 | 0.1318 | $736,969 | $5.59 |
| 2004 | 54,413 | 0.0544 | $218,005 | $4.01 |
| 2005 | 33,141 | 0.0331 | $272,703 | $8.23 |
| 2006 | 155,685 | 0.1557 | $1,258,306 | $8.08 |
| 2007 | 177,091 | 0.1771 | $1,408,676 | $7.95 |
| 2008 | 136,556 | 0.1366 | $1,014,667 | $7.43 |
| 2009 | 85,799 | 0.0858 | $595,356 | $6.94 |
| 2010 | 193,753 | 0.1938 | $1,547,293 | $7.99 |
| 2011 | 175,123 | 0.1751 | $1,747,931 | $9.98 |
Source: http://www.maine.gov/dmr/commercial-fishing/landings/documents/scallop.table.pdf (accessed January 29, 2018)


