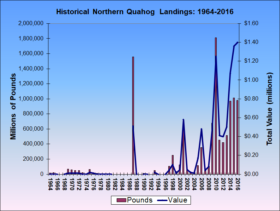
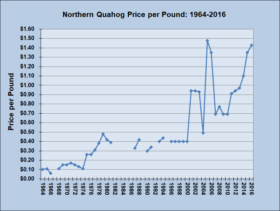
Harvesting Northern Quahogs by commercial fishermen has been a rocky business over the period for which data is available. (Gaps are related to quota regulations to protect the resource.) Otherwise known as “hard clams,” these shellfish are sometimes completely absent from the harvest rolls, sometimes overflowing.
Until the year 2001, the price per pound only once exceeded $.40. Thereafter, with peaks and valleys, the return has been $.90 per pound. As NOAA’s FishWatch notes,
Among the longest-lived marine species in the world, ocean quahogs grow slowly and have low reproduction rates, making them relatively unproductive and unable to support high levels of fishing. Knowing this, managers set harvest limits for the fishery at low levels to try to conserve the ocean quahog resource and keep it at target population levels.
. . . The Maine fishery is managed under a separate quota system.
The large ocean [northern] quahogs targeted by the fishery in U.S. federal waters have relatively small, dark, and tough meats and are used in processed clam products such as soups, chowders, and sauces. Smaller ocean quahogs from Maine waters are marketed as “mahogany clams” and are sold on the half-shell market or for steaming.*
| YEAR | LIVE POUNDS | VALUE | PRICE/LB |
| 1964 | 17,265 | $1,764 | $0.10 |
| 1965 | 19,114 | $2,074 | $0.11 |
| 1966 | 248 | $15 | $0.06 |
| 1967 | |||
| 1968 | 5,873 | $668 | $0.11 |
| 1969 | 67,207 | $9,762 | $0.15 |
| 1970 | 60,846 | $9,367 | $0.15 |
| 1971 | 48,026 | $7,994 | $0.17 |
| 1972 | 51,466 | $7,475 | $0.15 |
| 1973 | 23,409 | $2,943 | $0.13 |
| 1974 | 1,577 | $169 | $0.11 |
| 1975 | 62,536 | $16,395 | $0.26 |
| 1976 | 20,840 | $5,460 | $0.26 |
| 1977 | 10,364 | $3,220 | $0.31 |
| 1978 | 6,872 | $2,600 | $0.38 |
| 1979 | 4,544 | $2,200 | $0.48 |
| 1980 | 4,130 | $1,750 | $0.42 |
| 1981 | 1,652 | $650 | $0.39 |
| 1982 | |||
| 1983 | |||
| 1984 | |||
| 1985 | |||
| 1986 | |||
| 1987 | 1,555,223 | $508,303 | $0.33 |
| 1988 | 5,700 | $2,411 | $0.42 |
| 1989 | |||
| 1990 | 10,436 | $3,082 | $0.30 |
| 1991 | 331 | $111 | $0.34 |
| 1992 | |||
| 1993 | 51,158 | $20,520 | $0.40 |
| 1994 | 1,044 | $455 | $0.44 |
| 1995 | |||
| 1996 | 2,981 | $1,191 | $0.40 |
| 1997 | 106,508 | $42,544 | $0.40 |
| 1998 | 249,191 | $99,552 | $0.40 |
| 1999 | 36,875 | $14,727 | $0.40 |
| 2000 | 124,989 | $49,929 | $0.40 |
| 2001 | 616,069 | $579,104 | $0.94 |
| 2002 | 51,032 | $47,973 | $0.94 |
| 2003 | 17,529 | $16,355 | $0.93 |
| 2004 | 20,586 | $10,138 | $0.49 |
| 2005 | 117,315 | $173,342 | $1.48 |
| 2006 | 352,409 | $476,369 | $1.35 |
| 2007 | 65,423 | $44,966 | $0.69 |
| 2008 | 107,268 | $82,648 | $0.77 |
| 2009 | 681,243 | $468,741 | $0.69 |
| 2010 | 1,812,798 | $1,248,492 | $0.69 |
| 2011 | 454,106 | $414,921 | $0.91 |
| 2012 | 419,792 | $395,657 | $.94 |
| 2013 | 516,155 | $502,285 | $.97 |
| 2014 | 971,908 | $1,072,724 | $1.10 |
| 2015 | 1,013,067 | $1,363,417 | $1.35 |
| 2016 | 978,195 | $1,396,169 | $1.43 |
Source: http://www.maine.gov/dmr/commercial-fishing/landings/documents/HardClam.table.pdf (accessed January 29, 2018)
*http://www.fishwatch.gov/seafood_profiles/species/clams/species_pages/ocean_quahog_clam.htm (accessed 9/26/12)


