The median income for a group is that amount above which half the group has more and below which half the group has less. It is “in the middle.”
According to the U.S. Census:
Family. A family is a group of two people or more (one of whom is the householder) related by birth, marriage, or adoption and residing together; all such people (including related subfamily members) are considered as members of one family. See median family income.
Household. A household consists of all the people who occupy a housing unit. A house, an apartment or other group of rooms, or a single room, is regarded as a housing unit when it is occupied or intended for occupancy as separate living quarters; that is, when the occupants do not live and eat with any other persons in the structure and there is direct access from the outside or through a common hall.
A household includes the related family members and all the unrelated people, if any, such as lodgers, foster children, wards, or employees who share the housing unit. A person living alone in a housing unit, or a group of unrelated people sharing a housing unit such as partners or roomers, is also counted as a household.
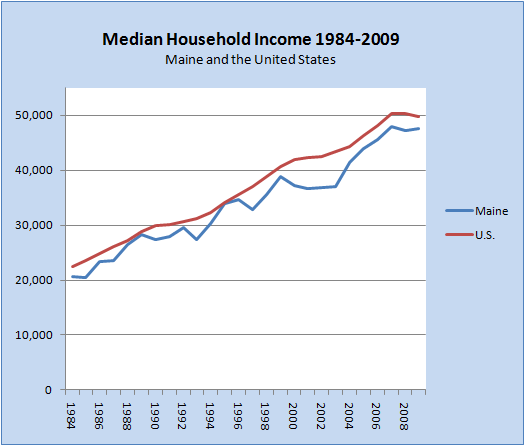
From 1984 through 2009, Maine’s household income was always less than that of the United States as a whole. Half of these years (the median) the difference was more than 6.4%. More Economic Data
| Median Household Income | Difference $ | Difference % | ||
| YEAR | Maine | U.S. | U.S. – Maine | U.S. – Maine |
| 1984 | $20,648 | $22,415 | $1,767 | 7.9% |
| 1985 | $20,519 | $23,618 | $3,099 | 13.1% |
| 1986 | $23,424 | $24,897 | $1,473 | 5.9% |
| 1987 | $23,600 | $26,061 | $2,461 | 9.4% |
| 1988 | $26,402 | $27,225 | $823 | 3.0% |
| 1989 | $28,221 | $28,906 | $685 | 2.4% |
| 1990 | $27,464 | $29,943 | $2,479 | 8.3% |
| 1991 | $27,868 | $30,126 | $2,258 | 7.5% |
| 1992 | $29,617 | $30,636 | $1,019 | 3.3% |
| 1993 | $27,438 | $31,241 | $3,803 | 12.2% |
| 1994 | $30,316 | $32,264 | $1,948 | 6.0% |
| 1995 | $33,858 | $34,076 | $218 | 0.6% |
| 1996 | $34,696 | $35,492 | $796 | 2.2% |
| 1997 | $32,772 | $37,005 | $4,233 | 11.4% |
| 1998 | $35,640 | $38,885 | $3,245 | 8.3% |
| 1999 | $38,862 | $40,696 | $1,834 | 4.5% |
| 2000 | $37,266 | $41,990 | $4,724 | 11.3% |
| 2001 | $36,612 | $42,228 | $5,616 | 13.3% |
| 2002 | $36,853 | $42,409 | $5,556 | 13.1% |
| 2003 | $37,113 | $43,318 | $6,205 | 14.3% |
| 2004 | $41,329 | $44,334 | $3,005 | 6.8% |
| 2005 | $43,923 | $46,326 | $2,403 | 5.2% |
| 2006 | $45,642 | $48,201 | $2,559 | 5.3% |
| 2007 | $47,894 | $50,233 | $2,339 | 4.7% |
| 2008 | $47,228 | $50,303 | $3,075 | 6.1% |
| 2009 | $47,502 | $49,777 | $2,275 | 4.6% |
Source: U.S. Census Bureau Table H-8. Median Household Income by State: 1984 to 2009 (Households as of March of the following year. Income in current and 2009 CPI-U-RS adjusted dollars) at http://www.census.gov/hhes/www/income/data/statemedian/index*.html (accessed August 20, 2011).
* The CPI-U-RS is a price index of inflation that incorporates most of the improvements in methodology made to the current CPI-U since 1978 into a single, uniform series. See http://www.census.gov/hhes/www/income/data/historical/ftnotes.html for more information.


