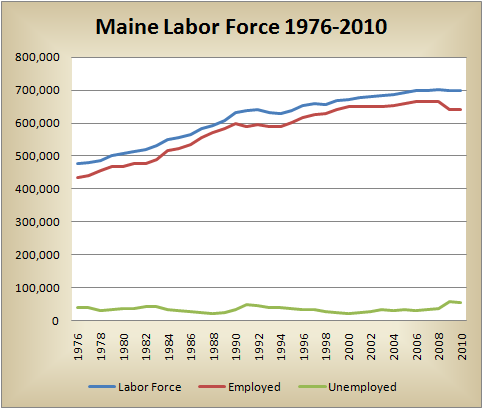
The labor force is defined as the total of people employed and those who are unemployed and seeking employment.
While growing in the long term, Maine’s total labor force actually contracts from time to time as people stop seeking employment. The recent rate of increase may be slowing as the population ages and in-migration of younger workers is insufficient to replace retirees.
| Year | Total | Employed | Unemployed |
| 1976 | 476,265 | 435,744 | 40,521 |
| 1977 | 481,709 | 441,823 | 39,886 |
| 1978 | 487,418 | 456,381 | 31,036 |
| 1979 | 500,374 | 467,466 | 32,908 |
| 1980 | 506,228 | 468,554 | 37,674 |
| 1981 | 512,622 | 476,094 | 36,528 |
| 1982 | 520,558 | 477,465 | 43,093 |
| 1983 | 532,810 | 490,350 | 42,460 |
| 1984 | 549,268 | 516,300 | 32,968 |
| 1985 | 554,686 | 523,928 | 30,758 |
| 1986 | 565,082 | 535,662 | 29,420 |
| 1987 | 582,397 | 557,257 | 25,140 |
| 1988 | 593,210 | 571,534 | 21,677 |
| 1989 | 608,649 | 584,292 | 24,357 |
| 1990 | 631,147 | 597,902 | 33,245 |
| 1991 | 638,869 | 590,604 | 48,266 |
| 1992 | 639,622 | 594,082 | 45,540 |
| 1993 | 631,404 | 589,800 | 41,604 |
| 1994 | 629,670 | 589,073 | 40,598 |
| 1995 | 638,694 | 601,565 | 37,130 |
| 1996 | 651,670 | 617,479 | 34,190 |
| 1997 | 658,153 | 624,410 | 33,743 |
| 1998 | 657,415 | 627,920 | 29,495 |
| 1999 | 667,673 | 641,351 | 26,322 |
| 2000 | 672,440 | 650,385 | 22,055 |
| 2001 | 675,981 | 650,699 | 25,282 |
| 2002 | 680,569 | 650,943 | 29,626 |
| 2003 | 684,689 | 650,458 | 34,231 |
| 2004 | 685,534 | 653,847 | 31,687 |
| 2005 | 692,327 | 658,507 | 33,820 |
| 2006 | 698,527 | 665,856 | 32,671 |
| 2007 | 699,206 | 666,305 | 32,901 |
| 2008 | 702,862 | 665,057 | 37,805 |
| 2009 | 698,401 | 641,189 | 57,212 |
| 2010 | 697,251 | 641,978 | 55,273 |
Source: Maine Department of Labor, Center for Workforce Research and Information, Labor Force Estimates and Charts, 1976-2011 (Excel), at http://www.maine.gov/labor/cwri/laus.html (accessed August 22, 2011)


