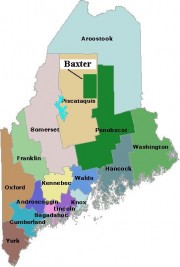
Hancock County is one of two downeast coastal counties located east of the Penobscot River. It was formed when the extensive Lincoln County split on June 25, 1789 by adding Hancock and Washington counties. The westerly portion of the new Hancock County was eventually split off to form Waldo County. See an 1860 map of the county in the Map Cabinet.
The county includes several major islands (Deer Isle, Swans Island, and Mount Desert Island) and Acadia National Park.
Currently the county consists of the following: towns of Amherst, Aurora, Bar Harbor, Blue Hill, Brooklin, Brooksville, Bucksport, Castine, Cranberry Isles, Dedham, Deer Isle, Eastbrook, Ellsworth, Franklin, Frenchboro, Gouldsboro, Great Pond, Hancock, Lamoine, Mariaville, Mount Desert, Orland, Osborn, Otis, Penobscot, Sedgwick, Sorrento, Southwest Harbor, Stonington, Sullivan, Surry, Swans Island, Tremont, Trenton, Verona Island, Waltham and Winter Harbor; and several unorganized townships.
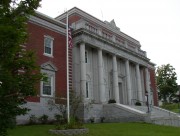
Castine was the first county seat until 1838 when the shire town was moved to the City of Ellsworth, which now hosts the county government, courthouse, and the county jail.
In 2010, Hancock County was Maine’s eighth largest county by population at 4.3% of the state’s total, with a census count of 54,418, a 5.1% more than in 2000.
| People QuickFacts (updated November 4, 2010) | Hancock County | Maine | |
|---|---|---|---|
| Population, 2009 estimate | 53,447 | 1,318,301 | |
| Population, percent change, April 1, 2000 to July 1, 2009 | 3.2% | 3.4% | |
| Population estimates base (April 1) 2000 | 51,791 | 1,274,915 | |
| Persons under 5 years old, percent, 2009 | 5.0% | 5.4% | |
| Persons under 18 years old, percent, 2009 | 18.6% | 20.6% | |
| Persons 65 years old and over, percent, 2009 | 17.3% | 15.6% | |
| Female persons, percent, 2009 | 50.9% | 51.2% | |
| White persons, percent, 2009 (a) | 97.1% | 96.1% | |
| Black persons, percent, 2009 (a) | 0.4% | 1.2% | |
| American Indian and Alaska Native persons, percent, 2009 (a) | 0.4% | 0.6% | |
| Asians percent, 2009 (a) | 0.8% | 1.0% | |
| Native Hawaiian and Other Pacific Islander, percent, 2009 (a) | Z | Z | |
| Persons reporting two or more races, percent, 2009 | 1.2% | 1.1% | |
| Persons of Hispanic or Latino origin, percent, 2009 (b) | 1.1% | 1.4% | |
| White persons not Hispanic, percent, 2009 | 96.1% | 94.9% | |
| Living in same house in 1995 and 2000, pct 5 yrs old & over | 61.7% | 59.6% | |
| Foreign born persons, percent, 2000 | 2.3% | 2.9% | |
| Language other than English at home, pct age 5+, 2000 | 3.6% | 7.8% | |
| High school graduates, percent of persons age 25+, 2000 | 87.8% | 85.4% | |
| Bachelor’s degree or higher, pct of persons age 25+, 2000 | 27.1% | 22.9% | |
| Persons with a disability, age 5+, 2000 | 9,287 | 237,910 | |
| Mean time to get to work (minutes), workers age 16+, 2000 | 22.4 | 22.7 | |
| Housing units, 2009 | 37,342 | 704,578 | |
| Homeownership rate, 2000 | 75.7% | 71.6% | |
| Housing units in multi-unit structures, percent, 2000 | 8.7% | 20.3% | |
| Median value of owner-occupied housing units, 2000 | $108,600 | $98,700 | |
| Households, 2000 | 21,864 | 518,200 | |
| Persons per household, 2000 | 2.31 | 2.39 | |
| Median household income, 2008 | $47,849 | $46,419 | |
| Per capita income, 1999 | $19,809 | $19,533 | |
| Persons below poverty level, percent, 2008 | 10.8% | 12.6% | |
| Business QuickFacts | Hancock County | Maine | |
|---|---|---|---|
| Private nonfarm establishments, 2008 | 2,199 | 41,7551 | |
| Private nonfarm employment, 2008 | 17,327 | 509,0931 | |
| Private nonfarm employment, percent change 2000-2008 | 1.3% | 3.5%1 | |
| Nonemployer establishments, 2008 | 7,506 | 113,522 | |
| Total number of firms, 2002 | 8,493 | 135,410 | |
| Black-owned firms, percent, 2002 | F | 0.2% | |
| American Indian and Alaska Native owned firms, percent, 2002 | F | 0.5% | |
| Asian-owned firms, percent, 2002 | F | 0.6% | |
| Native Hawaiian and Other Pacific Islander owned firms, percent, 2002 | F | S | |
| Hispanic-owned firms, percent, 2002 | F | 0.5% | |
| Women-owned firms, percent, 2002 | 20.2% | 24.0% | |
| Manufacturers shipments, 2002 ($1000) | 558,543 | 13,851,915 | |
| Wholesale trade sales, 2002 ($1000) | 196,905 | 10,371,084 | |
| Retail sales, 2002 ($1000) | 665,174 | 16,053,515 | |
| Retail sales per capita, 2002 | $12,733 | $12,370 | |
| Accommodation and foodservices sales, 2002 ($1000) | 145,110 | 2,045,841 | |
| Building permits, 2009 | 173 | 3,1211 | |
| Federal spending, 2008 | 484,081 | 11,974,3611 | |
| Geography QuickFacts | Hancock County | Maine | |
|---|---|---|---|
| Land area, 2000 (square miles) | 1,587.70 | 30,861.55 | |
| Persons per square mile, 2000 | 32.6 | 41.3 | |
| FIPS Code | 009 | 23 | |
| Metropolitan or Micropolitan Statistical Area | None |
(b) Hispanics may be of any race, so also are included in applicable race categories.D: Suppressed to avoid disclosure of confidential information
F: Fewer than 100 firms
FN: Footnote on this item for this area in place of data
NA: Not available
S: Suppressed; does not meet publication standards
X: Not applicable
Z: Value greater than zero but less than half unit of measure shown


