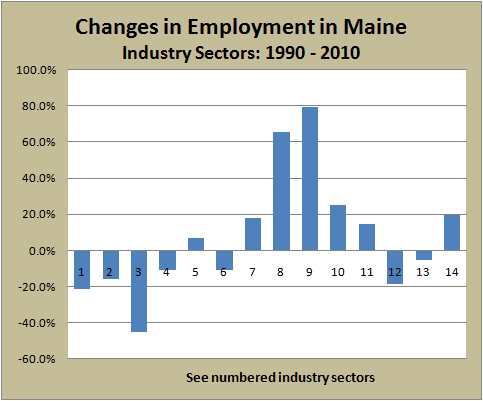
In 1990 Trade (17.5%) and Manufacturing (17.4%) constituted the largest employment sectors in the Maine economy. By 2010, Manufacturing had faded to 8.6%, and the top two employment sectors were Trade (17%) and Education and Health Services (20.2%). During the two decades, Manufacturing (No. 3 on the chart) had lost over 45% of its employees, while Education and Health Services (No. 9) had gained over 79%.
Overall, services, including government, added 25% more employees than in 1990; but non-services sectors lost nearly 38%. The number of state and federal government employees declined, while local governments added nearly 20% to their payrolls.
| Industry Sector | 1990 | 2000 | 2010 | Change | |
| 1 | Natural Resources and Mining | 3,300 | 2,700 | 2,600 | -21.2% |
| 2 | Construction | 28,800 | 29,200 | 24,300 | -15.6% |
| 3 | Manufacturing | 93,000 | 79,500 | 50,900 | -45.3% |
| 4 | Transportation & Public Utilities | 18,800 | 19,200 | 16,800 | -10.6% |
| 5 | Trade, Wholesale & Retail | 93,500 | 103,400 | 100,100 | 7.1% |
| 6 | Information | 10,200 | 12,100 | 9,100 | -10.8% |
| 7 | Finance, Insurance, Real Estate | 26,500 | 34,100 | 31,300 | 18.1% |
| 8 | Services, Professional & Business | 33,600 | 51,800 | 55,600 | 65.5% |
| 9 | Services, Education & Health | 66,400 | 97,500 | 119,000 | 79.2% |
| 10 | Services, Leisure & Hospitality | 47,800 | 55,900 | 59,800 | 25.1% |
| 11 | Services, Other | 17,300 | 18,300 | 19,800 | 14.5% |
| 12 | Federal Government | 19,200 | 14,300 | 15,600 | -18.8% |
| 13 | State Government | 26,100 | 26,700 | 24,700 | -5.4% |
| 14 | Local Government | 50,500 | 58,500 | 60,400 | 19.6% |
| Total Nonagricultural | 535,000 | 603,200 | 590,000 | 10.3% |
Source: Maine Department of Labor. Center for Workforce Research and Information. Nonfarm Wage and Salary Employment by Industry. http://www.maine.gov/labor/cwri/ces.html (accessed August 22, 2011)
Additional resources
Maine Department of Labor. Center for Workforce Research and Information. The Maine Labor Market 2010: Trends and Issues. Augusta, Me. September, 2010.


