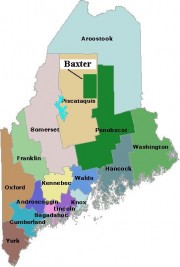
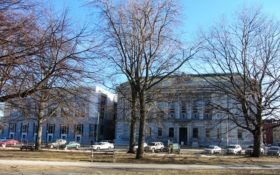
the most populous of Maine’s counties, contains approximately 20% of the state’s population with less than 3% of the state’s land area. Four of the ten largest communities by population are in Cumberland County. See an 1857 map of the county in the Map Cabinet.
The City of Portland dominates the cultural and commercial environment of the county, and for most of southern Maine. It is also an important transportation center, including Amtrak’s passenger rail service south, and bus transportation both north and south.
The University of Maine has campuses in Portland and Gorham. Other colleges with campuses in the county include Kaplan University (South Portland), Maine College of Art (Portland), St. Joseph’s College (Standish), Southern Maine Community College (South Portland), and Southern New Hampshire University (Brunswick).
In South Portland, the Maine Mall and nearby businesses constitute the largest concentration of commercial activity in the state.
The county was created in 1760 when York county was divided into two new counties: Lincoln and Cumberland. In 1805, the northern part of the county was set off to form another: Oxford County. Later in 1854, further land was set off to create the new Androscoggin County. Other minor adjustment have taken place from time-to-time.
 In 2011 Cumberland County, facing Casco Bay, contains the following: the cities of Portland, South Portland and Westbrook; and the towns of Baldwin, Bridgeton, Brunswick, Cape Elizabeth, Casco, Chebeague Island, Cumberland, Falmouth, Freeport, Frye Island, Gorham, Gray, Harpswell, Harrison, Long Island, Naples, New Gloucester, North Yarmouth, Pownal, Raymond, Scarborough, Sebago, Standish, Windham and Yarmouth.
The county hosts a number of nature preserves, many of which are coastal.
| People QuickFacts | Cumberland County | Maine | |
|---|---|---|---|
| Population, 2009 estimate | 278,559 | 1,318,301 | |
| Population, percent change, April 1, 2000 to July 1, 2009 | 4.9% | 3.4% | |
| Population estimates base (April 1) 2000 | 265,611 | 1,274,915 | |
| Persons under 5 years old, percent, 2009 | 5.5% | 5.4% | |
| Persons under 18 years old, percent, 2009 | 20.8% | 20.6% | |
| Persons 65 years old and over, percent, 2009 | 14.3% | 15.6% | |
| Female persons, percent, 2009 | 51.3% | 51.2% | |
| White persons, percent, 2009 (a) | 94.0% | 96.1% | |
| Black persons, percent, 2009 (a) | 2.5% | 1.2% | |
| American Indian and Alaska Native persons, percent, 2009 (a) | 0.4% | 0.6% | |
| Asians, percent, 2009 (a) | 1.8% | 1.0% | |
| Native Hawaiian and Other Pacific Islander, percent, 2009 (a) | 0.1% | Z | |
| Persons reporting two or more races, percent, 2009 | 1.1% | 1.1% | |
| Persons of Hispanic or Latino origin, percent, 2009 (b) | 2.0% | 1.4% | |
| White persons not Hispanic, percent, 2009 | 92.3% | 94.9% | |
| Living in same house in 1995 and 2000, pct 5 yrs old & over | 54.2% | 59.6% | |
| Foreign born persons, percent, 2000 | 3.8% | 2.9% | |
| Language other than English spoken at home, pct age 5+, 2000 | 5.9% | 7.8% | |
| High school graduates, percent of persons age 25+, 2000 | 90.1% | 85.4% | |
| Bachelor’s degree or higher, pct of persons age 25+, 2000 | 34.2% | 22.9% | |
| Persons with a disability, age 5+, 2000 | 42,102 | 237,910 | |
| Mean time to work (minutes), workers age 16+, 2000 | 22.0 | 22.7 | |
| Housing units, 2009 | 134,295 | 704,578 | |
| Homeownership rate, 2000 | 66.8% | 71.6% | |
| Housing units in multi-unit structures, percent, 2000 | 28.2% | 20.3% | |
| Median value of owner-occupied housing units, 2000 | $131,200 | $98,700 | |
| Households, 2000 | 107,989 | 518,200 | |
| Persons per household, 2000 | 2.38 | 2.39 | |
| Median household income, 2008 | $54,053 | $46,419 | |
| Per capita income, 1999 | $23,949 | $19,533 | |
| Persons below poverty level, percent, 2008 | 10.4% | 12.6% | |
| Business QuickFacts | Cumberland County | Maine | |
|---|---|---|---|
| Private nonfarm establishments, 2008 | 11,105 | 41,7551 | |
| Private nonfarm employment, 2008 | 160,520 | 509,0931 | |
| Private nonfarm employment, percent change 2000-2008 | 6.9% | 3.5%1 | |
| Nonemployer establishments, 2008 | 25,162 | 113,522 | |
| Total number of firms, 2002 | 31,011 | 135,410 | |
| Black-owned firms, percent, 2002 | 0.4% | 0.2% | |
| American Indian and Alaska Native owned firms, %, 2002 | F | 0.5% | |
| Asian-owned firms, percent, 2002 | 0.9% | 0.6% | |
| Native Hawaiian, Other Pacific Islander owned firms, %, 2002 | F | S | |
| Hispanic-owned firms, percent, 2002 | 1.1% | 0.5% | |
| Women-owned firms, percent, 2002 | 27.2% | 24.0% | |
| Manufacturers shipments, 2002 ($1000) | 2,137,412 | 13,851,915 | |
| Wholesale trade sales, 2002 ($1000) | 5,807,142 | 10,371,084 | |
| Retail sales 2002 ($1000) | 4,386,091 | 16,053,515 | |
| Retail sales per capita, 2002 | $16,252 | $12,370 | |
| Accommodation and foodservices sales, 2002 ($1000) | 573,621 | 2,045,841 | |
| Building permits, 2009 | 575 | 3,1211 | |
| Federal spending, 2008 | 2,145,559 | 11,974,3611 | |
| Geography QuickFacts | Cumberland County | Maine | |
|---|---|---|---|
| Land area, 2000 (square miles) | 835.51 | 30,861.55 | |
| Persons per square mile, 2000 | 317.7 | 41.3 | |
| FIPS Code | 005 | 23 | |
| Metropolitan or Micropolitan Statistical Area | Portland-South Portland-Biddeford, ME Metro Area |
U.S. Census Table Notes: F=fewer than 100 firms; S=supressed, data does not meet publication standards; Z=greater than zero, but less than 1/2 percent; (a)=includes persons reporting only one race; (b)=Hispanics may be of any race, so also are included in applicable race categories.
Source: http://quickfacts.census.gov/qfd/states/23/23005.html (accessed February 15, 2011)


