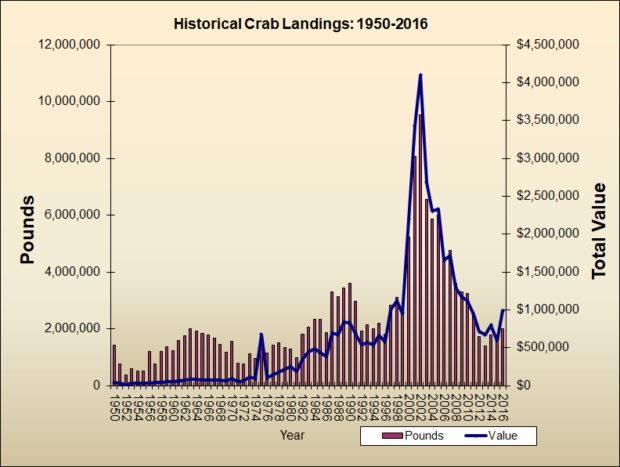
Included here are the folowing species: Cancer, Jonah, Rock, Spider, and others unspecified. Since 1950 harvests in the range of one to three million pounds were the norm until a brief boom (2001-2007) changed things. But recently the old range has returned, but will it last?
| YEAR | POUNDS | POUNDS (millions) | VALUE | PRICE/LB |
| 1950 | 1,434,400 | 1.4 | $37,654 | $0.03 |
| 1951 | 749,700 | 0.7 | $27,731 | $0.04 |
| 1952 | 375,400 | 0.4 | $15,204 | $0.04 |
| 1953 | 598,400 | 0.6 | $29,110 | $0.05 |
| 1954 | 519,600 | 0.5 | $27,498 | $0.05 |
| 1955 | 499,300 | 0.5 | $25,977 | $0.05 |
| 1956 | 1,199,700 | 1.2 | $34,797 | $0.03 |
| 1957 | 756,400 | 0.8 | $36,462 | $0.05 |
| 1958 | 1,210,400 | 1.2 | $45,828 | $0.04 |
| 1959 | 1,358,500 | 1.4 | $54,964 | $0.04 |
| 1960 | 1,225,300 | 1.24 | $53,636 | $0.04 |
| 1961 | 1,579,300 | 1.6 | $58,385 | $0.04 |
| 1962 | 1,751,500 | 1.8 | $67,952 | $0.04 |
| 1963 | 2,010,900 | 2.0 | $84,522 | $0.04 |
| 1964 | 1,914,617 | 1.9 | $78,155 | $0.04 |
| 1965 | 1,847,907 | 1.8 | $73,591 | $0.04 |
| 1966 | 1,774,188 | 1.8 | $75,111 | $0.04 |
| 1967 | 1,678,413 | 1.7 | $75,623 | $0.05 |
| 1968 | 1,452,647 | 1.5 | $77,275 | $0.05 |
| 1969 | 1,185,061 | 1.2 | $66,460 | $0.06 |
| 1970 | 1,571,140 | 1.6 | $89,651 | $0.06 |
| 1971 | 789,765 | 0.8 | $52,326 | $0.07 |
| 1972 | 753,805 | 0.8 | $63,020 | $0.08 |
| 1973 | 1,121,197 | 1.1 | $109,004 | $0.10 |
| 1974 | 963,820 | 1.0 | $91,902 | $0.10 |
| 1975 | 1,271,164 | 1.3 | $676,706 | $0.53 |
| 1976 | 1,143,725 | 1.13 | $101,525 | $0.09 |
| 1977 | 1,433,596 | 1.4. | $142,106 | $0.10 |
| 1978 | 1,510,374 | 1.5 | $180,474 | $0.12 |
| 1979 | 1,344,179 | 1.3 | $213,616 | $0.16 |
| 1980 | 1,275,695 | 1.3 | $248,401 | $0.19 |
| 1981 | 987,966 | 1.0 | $188,733 | $0.19 |
| 1982 | 1,802,225 | 1.8 | $345,681 | $0.19 |
| 1983 | 2,042,635 | 2.0 | $445,953 | $0.22 |
| 1984 | 2,330,960 | 2.3 | $481,853 | $0.21 |
| 1985 | 2,321,353 | 2.3 | $438,486 | $0.19 |
| 1986 | 1,862,525 | 1.9 | $383,215 | $0.21 |
| 1987 | 3,303,457 | 3.3 | $693,737 | $0.21 |
| 1988 | 3,120,498 | 3.1 | $667,531 | $0.21 |
| 1989 | 3,433,600 | 3.4 | $839,926 | $0.24 |
| 1990 | 3,596,796 | 3.6 | $831,615 | $0.23 |
| 1991 | 2,968,451 | 3.0 | $687,576 | $0.23 |
| 1992 | 1,930,396 | 1.9 | $540,158 | $0.28 |
| 1993 | 2,124,193 | 2.1 | $569,915 | $0.27 |
| 1994 | 2,012,073 | 2.0 | $536,073 | $0.27 |
| 1995 | 2,193,658 | 2.2 | $658,691 | $0.30 |
| 1996 | 1,800,214 | 1.8 | $578,015 | $0.32 |
| 1997 | 2,820,385 | 2.8 | $1,002,918 | $0.36 |
| 1998 | 3,107,696 | 3.1 | $1,115,038 | $0.36 |
| 1999 | 2,752,114 | 2.8 | $952,452 | $0.35 |
| 2000 | 5,236,116 | 5.2 | $2,196,336 | $0.42 |
| 2001 | 8,060,739 | 8.1 | $3,431,119 | $0.43 |
| 2002 | 9,535,876 | 9.5 | $4,101,047 | $0.43 |
| 2003 | 6,554,938 | 6.6 | $2,684,181 | $0.41 |
| 2004 | 5,861,264 | 5.9 | $2,302,868 | $0.39 |
| 2005 | 6,005,511 | 6.09 | $2,330,780 | $0.39 |
| 2006 | 4,489,143 | 4.5 | $1,650,636 | $0.37 |
| 2007 | 4,768,539 | 4.8 | $1,713,728 | $0.36 |
| 2008 | 3,588,542 | 3.6 | $1,295,444 | $0.36 |
| 2009 | 3,289,739 | 3.3 | $1,174,027 | $0.36 |
| 2010 | 3,231,202 | 3.2 | $1,113,591 | $0.34 |
| 2011 | 2,477,058 | 2.5 | $943,612 | $0.38 |
| 2012 | 1,725,695 | 1.7 | $709,865 | $0.41 |
| 2013 | 1,383.877 | 1.4 | $668,011 | $0.48 |
| 2014 | 1,777,966 | 1.8 | $800,270 | $0.45 |
| 2015 | 1,778,359 | 1.8 | $594,703 | $0.33 |
| 2016 | 1,997,182 | 2.0 | $992,450 | $0.50 |
Source: Maine. Department of Marne Resources. http://www.maine.gov/dmr/commercial-fishing/landings/documents/crabcombo.table.pdf (accessed January 25, 2018)


