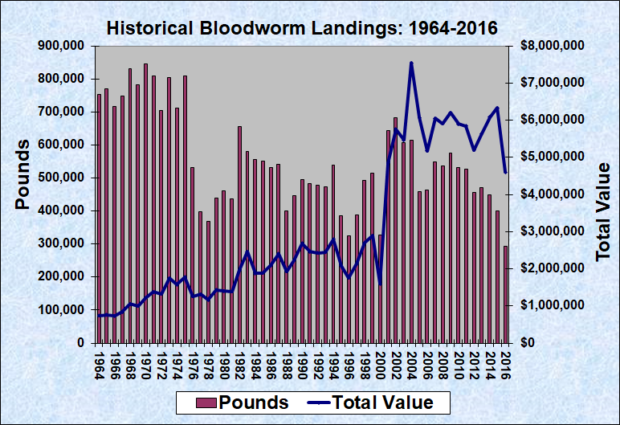
In the decade from 1964 through 1974, harvests were relatively high and total value was low. Since then harvests had been lower and prices moderate until 2001 when values doubled and remained high through 2011. Bloodworms, often used as fish bait in commercial fisheries, are one of several marine worms found in Maine.
| YEAR | POUNDS | POUNDS (millions) |
VALUE | PRICE/LB |
| 1964 | 753,414 | 0.7534 | $740,815 | $0.98 |
| 1965 | 769,936 | 0.7699 | $759,582 | $0.99 |
| 1966 | 716,211 | 0.7162 | $731,335 | $1.02 |
| 1967 | 748,110 | 0.7481 | $834,826 | $1.12 |
| 1968 | 831,551 | 0.8316 | $1,049,581 | $1.26 |
| 1969 | 782,002 | 0.7820 | $999,787 | $1.28 |
| 1970 | 845,404 | 0.8454 | $1,215,772 | $1.44 |
| 1971 | 808,186 | 0.8082 | $1,381,676 | $1.71 |
| 1972 | 703,986 | 0.7040 | $1,325,895 | $1.88 |
| 1973 | 803,158 | 0.8032 | $1,744,832 | $2.17 |
| 1974 | 712,262 | 0.7123 | $1,569,823 | $2.20 |
| 1975 | 808,903 | 0.8089 | $1,779,266 | $2.20 |
| 1976 | 532,401 | 0.5324 | $1,255,852 | $2.36 |
| 1977 | 396,652 | 0.3967 | $1,313,987 | $3.31 |
| 1978 | 367,783 | 0.3678 | $1,164,688 | $3.17 |
| 1979 | 440,092 | 0.4401 | $1,434,258 | $3.26 |
| 1980 | 461,683 | 0.4617 | $1,404,222 | $3.04 |
| 1981 | 437,004 | 0.4370 | $1,394,341 | $3.19 |
| 1982 | 656,696 | 0.6567 | $1,962,712 | $2.99 |
| 1983 | 580,519 | 0.5805 | $2,463,415 | $4.24 |
| 1984 | 555,789 | 0.5558 | $1,878,826 | $3.38 |
| 1985 | 550,559 | 0.5506 | $1,882,636 | $3.42 |
| 1986 | 530,454 | 0.5305 | $2,087,210 | $3.93 |
| 1987 | 542,142 | 0.5421 | $2,404,139 | $4.43 |
| 1988 | 400,139 | 0.4001 | $1,932,865 | $4.83 |
| 1989 | 447,059 | 0.4471 | $2,233,164 | $5.00 |
| 1990 | 493,821 | 0.4938 | $2,685,408 | $5.44 |
| 1991 | 483,428 | 0.4834 | $2,456,587 | $5.08 |
| 1992 | 478,264 | 0.4783 | $2,431,139 | $5.08 |
| 1993 | 472,038 | 0.4720 | $2,447,724 | $5.19 |
| 1994 | 537,594 | 0.5376 | $2,796,184 | $5.20 |
| 1995 | 384,692 | 0.3847 | $2,077,334 | $5.40 |
| 1996 | 324,093 | 0.3241 | $1,757,221 | $5.42 |
| 1997 | 387,374 | 0.3874 | $2,131,731 | $5.50 |
| 1998 | 492,615 | 0.4926 | $2,702,488 | $5.49 |
| 1999 | 514,717 | 0.5147 | $2,887,769 | $5.61 |
| 2000 | 327,189 | 0.3272 | $1,592,299 | $4.87 |
| 2001 | 644,374 | 0.6444 | $4,851,471 | $7.53 |
| 2002 | 682,994 | 0.6830 | $5,759,384 | $8.43 |
| 2003 | 607,070 | 0.6071 | $5,468,508 | $9.01 |
| 2004 | 614,824 | 0.6148 | $7,503,353 | $12.20 |
| 2005 | 458,017 | 0.4580 | $6,064,168 | $13.24 |
| 2006 | 462,357 | 0.4624 | $5,176,316 | $11.20 |
| 2007 | 549,043 | 0.5490 | $6,050,904 | $11.02 |
| 2008 | 537,011 | 0.5370 | $5,912,663 | $11.01 |
| 2009 | 574,364 | 0.5744 | $6,196,709 | $10.79 |
| 2010 | 532,669 | 0.5327 | $5,874,418 | $11.06 |
| 2011 | 525,859 | 0.5259 | $5,847,315 | $11.12 |
| 2012 | 457,037 | 0.4570 | $5,190,554 | $11.36 |
| 2013 | 470,243 | 0.4702 | $5642,886 | $12.00 |
| 2014 | 477,767 | 0.4478 | $6,084,513 | $13.59 |
| 2015 | 400,895 | 0.4009 | $6,333,467 | $15.80 |
| 2016 | 292,649 | 0.2926
|
$4,598,309 | $15.71 |
Source: http://www.maine.gov/dmr/commercial-fishing/landings/documents/bloodworms.table.pdf (accessed January 25, 2018) Latest data are preliminary.


