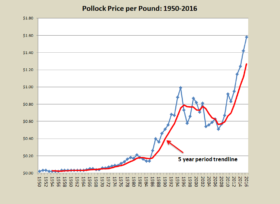
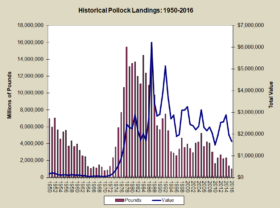
From 1950 to about 1974, commercial fishermen saw relatively low total value and prices per pound when landing American Pollock. Then the landings increased and so did the total value and the per pound price.
As the big landings began to decline, the price per pound climbed to a range between $.60 and $.80. With landings of about 2 million pounds per year, the fishery appears less endangered than some others.
| YEAR | POUNDS | VALUE | PRICE/LB |
| 1950 | 6,949,800 | $160,091 | $0.02 |
| 1951 | 5,971,800 | $207,002 | $0.03 |
| 1952 | 7,052,000 | $189,899 | $0.03 |
| 1953 | 5,633,900 | $133,446 | $0.02 |
| 1954 | 4,529,300 | $105,388 | $0.02 |
| 1955 | 5,415,900 | $125,103 | $0.02 |
| 1956 | 5,585,600 | $125,044 | $0.02 |
| 1957 | 3,719,600 | $97,271 | $0.03 |
| 1958 | 4,364,000 | $141,155 | $0.03 |
| 1959 | 3,689,000 | $113,174 | $0.03 |
| 1960 | 3,974,700 | $106,759 | $0.03 |
| 1961 | 3,206,100 | $103,355 | $0.03 |
| 1962 | 2,569,000 | $83,318 | $0.03 |
| 1963 | 2,488,600 | $73,482 | $0.03 |
| 1964 | 1,321,336 | $44,116 | $0.03 |
| 1965 | 1,092,640 | $47,162 | $0.04 |
| 1966 | 1,277,931 | $59,635 | $0.05 |
| 1967 | 1,095,055 | $54,723 | $0.05 |
| 1968 | 1,504,416 | $58,103 | $0.04 |
| 1969 | 1,212,223 | $50,209 | $0.04 |
| 1970 | 810,966 | $49,378 | $0.06 |
| 1971 | 890,268 | $55,369 | $0.06 |
| 1972 | 1,325,834 | $92,823 | $0.07 |
| 1973 | 2,356,724 | $187,118 | $0.08 |
| 1974 | 3,594,008 | $328,327 | $0.09 |
| 1975 | 5,916,759 | $547,344 | $0.09 |
| 1976 | 7,717,166 | $874,133 | $0.11 |
| 1977 | 10,685,179 | $1,405,744 | $0.13 |
| 1978 | 15,466,479 | $2,445,942 | $0.16 |
| 1979 | 13,139,499 | $2,304,685 | $0.18 |
| 1980 | 13,512,109 | $2,247,223 | $0.17 |
| 1981 | 13,712,517 | $2,882,458 | $0.21 |
| 1982 | 12,005,873 | $2,183,236 | $0.18 |
| 1983 | 11,113,324 | $1,724,382 | $0.16 |
| 1984 | 14,512,747 | $2,025,078 | $0.14 |
| 1985 | 12,387,232 | $1,701,591 | $0.14 |
| 1986 | 10,947,351 | $2,798,608 | $0.26 |
| 1987 | 15,560,632 | $6,216,374 | $0.40 |
| 1988 | 9,774,556 | $3,502,810 | $0.36 |
| 1989 | 6,140,953 | $2,835,515 | $0.46 |
| 1990 | 5,664,213 | $2,907,161 | $0.51 |
| 1991 | 6,972,351 | $3,879,213 | $0.56 |
| 1992 | 7,523,866 | $5,130,825 | $0.68 |
| 1993 | 5,573,935 | $3,732,562 | $0.67 |
| 1994 | 3,074,755 | $2,706,542 | $0.88 |
| 1995 | 2,904,864 | $2,874,447 | $0.99 |
| 1996 | 2,598,742 | $1,889,808 | $0.73 |
| 1997 | 3,373,173 | $1,971,567 | $0.58 |
| 1998 | 4,672,666 | $3,097,611 | $0.66 |
| 1999 | 3,567,574 | $3,111,134 | $0.87 |
| 2000 | 3,955,032 | $3,258,044 | $0.82 |
| 2001 | 3,446,768 | $2,447,862 | $0.71 |
| 2002 | 2,958,177 | $2,385,568 | $0.81 |
| 2003 | 4,084,978 | $2,206,167 | $0.54 |
| 2004 | 4,190,200 | $2,346,892 | $0.56 |
| 2005 | 5,258,613 | $3,104,506 | $0.59 |
| 2006 | 3,678,191 | $2,309,060 | $0.63 |
| 2007 | 4,249,066 | $2,159,728 | $0.51 |
| 2008 | 4,063,929 | $2,315,971 | $0.57 |
| 2009 | 3,040,387 | $2,046,629 | $0.67 |
| 2010 | 1,640,355 | $1,502,498 | $0.92 |
| 2011 | 2,324,875 | $1,919,852 | $0.83 |
| 2012 | 2,665,811 | $2,526,892 | $0.95 |
| 2013 | 2,226,593 | $2,560,807 | $1.15 |
| 2014 | 2,318,515 | $2,878,378 | $1.24 |
| 2015 | 1,381,059 | $1,963,082 | $1.42 |
| 2016 | 1,049,294 | $1,662,741 | $1.58 |
Source: http://www.maine.gov/dmr/commercial-fishing/landings/documents/pollock.table.pd (accessed January 26, 2018)


