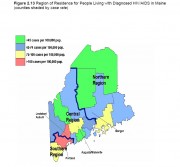
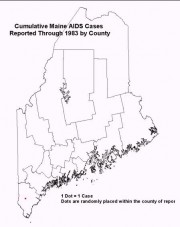
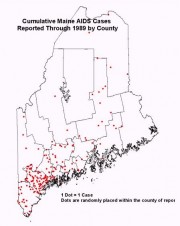
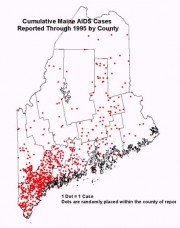
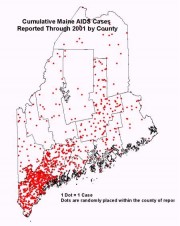
The following maps, created by the Maine Bureau of Health, illustrate the spread of AIDS cases over the past two decades. Click on each map to see a larger, clearer version.
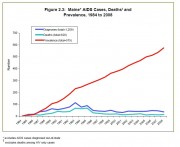
Figure 2.3 (figure numbers are from the 2009 DHHS report cited below) below illustrates Maine AIDS diagnoses by year of diagnosis from 1984 to 2008, reported deaths among person with AIDS, and the cumulative prevalence (the number
of people living in
the state with HIV)
of AIDS cases during that period. (See how Maine ranks.
The graph shows a general decline in both new diagnoses and deaths, with the number of deaths in recent years at their lowest point since the 1980’s. The number of new diagnoses, which increased during 1999, has declined since then. Overall declines are due in large part to widespread use of effective medical treatments for HIV disease.
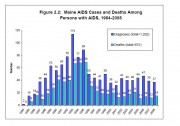
Figure 2.2 at right notes the actual number of AIDS cases identified each year and the number of deaths among persons with AIDS. Even though since 1986 the number of new diagnoses remained about the same, the number of deaths has declined.
More recent data from the Maine CDC show new HIV diagnoses 2009-2013 as 56, 59, 54, 48, 39; AIDS diagnoses as 35, 27, 28, 31, 30. In 2013 the number of people living with AIDS in Maine was 1,706.
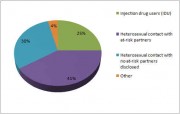
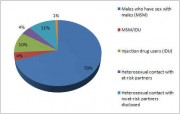
The figures below show the reported mode of transmission of “People Living with Diagnosed HIV Infection,” males (left) and females. These include people living with AIDS or HIV according to confidential disease reports made to the Bureau of Health.
According to these data, several key populations continue to be disproportionately affected by HIV in Maine. These include males who have sex with males, who comprise 70% of people with diagnosed HIV for whom mode of transmission is known; another 11% has sexual contact with women with no know HIV risk, injection drug use accounts for an additional 10%. For women, the major risk is having sexual contact with men at risk of having AIDS (41%), sexual contact with men with no know HIV risk (30%, and injection drug use (25%).
The number of people for whom risk is misclassified is not known. People infected through contaminated blood products and mother-to-infant transmissions represent a small number of people living with diagnosed HIV infection, with no transmissions for either of these categories occurring in recent years.
The majority of persons affected by HIV in Maine are of the White non-Hispanic racial ethnic category, with this group comprising 91% of 2008 diagnoses and 89% of persons living with diagnosed HIV/AIDS. After Whites, Blacks/African Americans comprise the second-largest racial/ethnic group, at 9% of 2008 diagnoses and 9% of people living with diagnosed HIV/AIDS in 2008. Hispanics are also disproportionately affected by HIV in Maine, comprising 2% of 2008 diagnoses and 6% of people living with diagnosed HIV/AIDS.
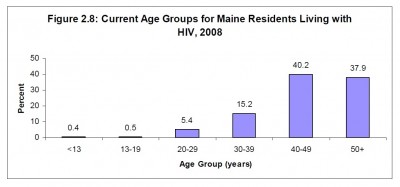
As following figure illustrates, age ranges reflecting age of those living with HIV in 2008. The vast majority were over 40 years of age. About twenty percent were between 20 and 40 years of age.
Sources:
State of Maine 2009 HIV/AIDS Epidemiological Profile. Maine Department of Health and Human Services (DHHS), Maine Center for Disease Control and Prevention (Maine CDC), Division of Infectious Disease. At http://www.maine.gov/dhhs/boh/ddc/hiv-std/pdf/Maine-Epidemiologic-Profile-2009.pdf.
“2013 Annual HIV/STD Surveillance Report” http://www.maine.gov/dhhs/mecdc/infectious-disease/hiv-std/data/hiv.shtml
Data and maps for 1983, 1989, 1995, and 2001 are from Maine Department of Health and Human Services (DHHS), Bureau of Health.


