 Abortion has been the center of political conflict for much of the last one hundred years, but especially so since the United State Supreme Court ruled in 1973, in the case of Roe v. Wade, that prohibition of abortion is an unconstitutional invasion of a woman’s right to privacy. However, the Court did allow for the possibility of “important state interests in regulation.” What these regulations may be has been the focus of many legal and political disputes.
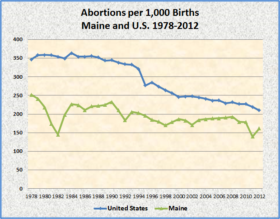
Both the Maine Department of Health and Human Services (DHHS) and the federal Department of Health and Human Services, Centers for Disease Control and Prevention (CDC) have published statistics tracking abortions. While in basic agreement, modest differences are reported. Even for the CDC, data is scattered among several sites and tables. [Click on charts to enlarge]
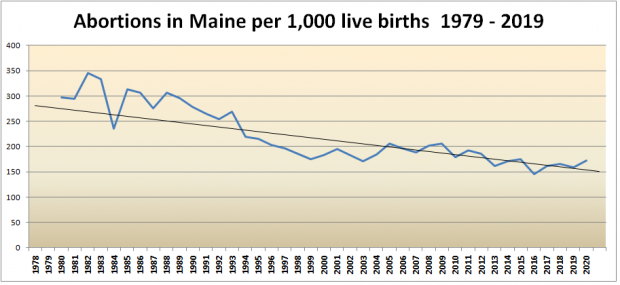
The chart below is an update that focuses on Maine only abortion events and extends the timespan of the data to over 40 years..
 Reported legal abortions in Maine average 3,571 per year from 1978 until 1994. During that period the reports fluctuated widely from 4,500 to 2,500, the back to 4,000. Thereafter, the number has declined to average 2,600 per year and has remained relatively stable. Assuming the 1978-1994 period averaged 4,000 abortions, the 2015 figure of 2,379 is 40% below that earlier average.
One common measure of abortions is the number performed in relation to the number of live births each year. In Maine, before 1994, virtually every year the number was over 200; since then it has decline to an average of about 178 in the period 1995-2014.
Maine abortion rates per 1,000 births have been consistently below the national averages. An average of 3.4% of abortions in Maine since 1996 are for out-of-state residents, again below the national average of about 8.5%.
| Abortions Maine | Abortions United States | ||||
| Year | Annual Total |
/1000 Births |
Annual Total |
/1000 Births |
/1000 15-44* |
| 1978 | 4,011 | 252 | 1,362,264 | 347 |
23 |
| 1979 | 3,963 | 241 | 1,251,921 | 358 |
24 |
| 1980 | 3,594 | 218 | 1,297,606 | 359 |
25 |
| 1981 | 2,881 | 174 | 1,300,760 | 358 |
24 |
| 1982 | 2,419 | 145 | 1,303,980 |
354 |
24 |
| 1983 | 3,279 | 198 | 1,403,706 | 349 |
23 |
| 1984 | 3,767 | 227 | 1,333,521 | 364 |
24 |
| 1985 | 3,784 | 224 | 1,328,570 | 354 |
24 |
| 1986 | 3,521 | 211 | 1,328,112 | 354 |
23 |
| 1987 | 3,698 | 221 | 1,353,671 | 356 |
24 |
| 1988 | 3,818 | 222 | 1,371,285 | 352 |
24 |
| 1989 | 3,921 | 225 | 1,396,658 | 344 |
24 |
| 1990 | 4,028 | 266 | 1,429,577 | 345 |
24 |
| 1991 | 3,520 | 228 | 1,388,937 | 338 |
24 |
| 1992 | 2,935 | 201 | 1,359,145 | 334 |
23 |
| 1993 | 3,095 | 219 | 1,330,414 | 333 |
21 |
| 1994 | 2,916 | 215 | 1,267,415 | 321 |
21 |
| 1995 | 2,717 | 196 | 1,210,883 | 277 | 18 |
| 1996 | 2,539 | 190 | 1,221,585 | 285 |
18 |
| 1997 | 2,454 | 186 | 1,186,039 | 274 |
17 |
| 1998 | 2,335 | 175 | 884,273 | 264 |
17 |
| 1999 | 2,427 | 178 | 861,789 | 256 |
17 |
| 2000 | 2,536 | 186 | 857,475 | 246 |
16 |
| 2001 | 2,515 | 183 | 853,485 | 247 |
16 |
| 2002 | 2,315 | 171 | 854,122 | 248 |
16 |
| 2003 | 2,550 | 184 | 848,163 | 245 |
16 |
| 2004 | 2,593 | 186 | 839,226 | 241 |
16 |
| 2005 | 2,653 | 180 | 820,151 | 236 |
16 |
| 2006 | 2,672 | 185 | 846,181 | 237 |
16 |
| 2007 | 2,689 | 187 | 827,609 | 229 |
16 |
| 2008 | 2,623 | 193 | 808,528 | 232 | 16 |
| 2009 | 2413 | 179 | 779,278 | 227 | 15 |
| 2010 | 2411 | 178 | 754,780 | 227 | 15 |
| 2011 | 1772 | 140 | 719,530 | 219 | 14 |
| 2012 | 2046 | 161 | 688,149 | 220 | 13 |
| 2013 | 1939 | 153 | |||
| 2014 | 2021 | 163 | |||
| 2015 | 1836 | ||||
Green data from Maine Department of Human Services; all other data from U.S. CDC
* abortions per 1,000 women age 15-44
Additional resources
Maine Department of Human Services. Office of Data, Research, and Vital Statistics. Induced abortions: Abortions Occurring in Maine: 1986, 1989, 1992, 1995. Augusta, Me. Office of Data, Research, and Vital Statistics, Bureau of Health. 1998.
CDC. “Abortion Surveillance — United States, 2012.”https://www.cdc.gov/mmwr/preview/mmwrhtml/ss6410a1.htm?s_cid=ss6410a1_e (accessed January 3, 2017)
CDC. “Abortion Surveillance — United States”, (various years). 2007 – 1978 links from http://www.cdc.gov/reproductivehealth/data_stats/index.htm#Abortion (accessed October 3, 2013)
CDC. “Abortion Surveillance — United States, 1992.” This covered the period 1970-1992, detailing total number of abortions and the rate of abortions among women 15 to 44. https://www.cdc.gov/mmwr/preview/mmwrhtml/00041486.htm#00001642.htm (accessed January 3, 2017)
CDC. “Abortion Surveillance — United States, 2003.” This covered the period 1970-2003, detailing total number of abortions and the rate of abortions among women 15 to 44. (accessed January 3, 2017)
CDC. “Table 7. Legal abortions, legal abortion rates, and legal abortion ratios: United States and 47 continuous reporting areas, 2003–2012. ” Source ofU.S. data from 2003-2012. https://www.cdc.gov/nchs/data/hus/2015/007.pdf (accessed January 3, 2017)
U.S. Supreme Court. ROE v. WADE, 410 U.S. 113 (1973). FindLaw for Legal Professionals at http://caselaw.lp.findlaw.com/scripts/getcase.pl?court=US&vol=410&invol=113. (accessed 1/20/2006)


