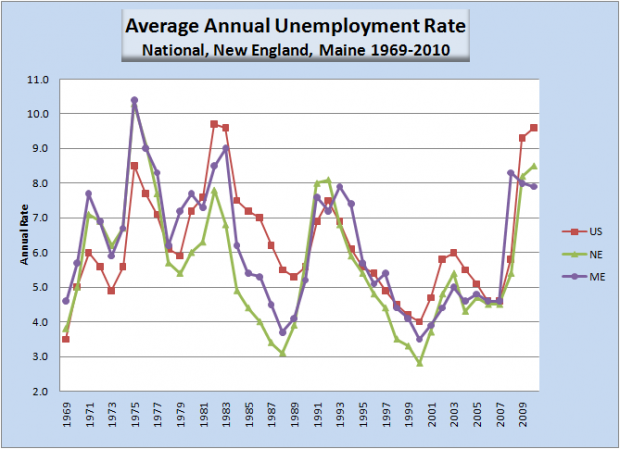
Average annual unemployment in Maine’s economy was consistently higher than the national average from 1969 through 1980. For the next decade, 1981 through 1990, the opposite was true! Since then, Maine’s annual unemployment rate has generally tracked the national rate, though usually a bit higher than the New England rate.
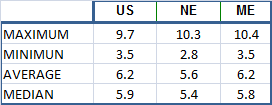
Over the four decades, 1969-2010, overall unemployment statistics show a close relationship between the national and the State of Maine figures: same minimum, same average, virtually the same median. On these measures, New England is consistenly lower in unemployment than the national or Maine experiences.
Source: Federal Reserve Bank of Boston and “Regional and State State Unemployment” (Annual) from the federal Bureau of Labor Statistics at http://www.bls.gov/schedule/archives/all_nr.htm#SRGUNE (accessed 11/1/2010 an 8/17/11).
Average Annual Unemployment Rate %
| Year | US | NE | ME |
| 1969 | 3.5 | 3.8 | 4.6 |
| 1970 | 5.0 | 5.0 | 5.7 |
| 1971 | 6.0 | 7.1 | 7.7 |
| 1972 | 5.6 | 6.9 | 6.9 |
| 1973 | 4.9 | 6.2 | 5.9 |
| 1974 | 5.6 | 6.7 | 6.7 |
| 1975 | 8.5 | 10.3 | 10.4 |
| 1976 | 7.7 | 9.1 | 9.0 |
| 1977 | 7.1 | 7.7 | 8.3 |
| 1978 | 6.1 | 5.7 | 6.2 |
| 1979 | 5.9 | 5.4 | 7.2 |
| 1980 | 7.2 | 6.0 | 7.7 |
| 1981 | 7.6 | 6.3 | 7.3 |
| 1982 | 9.7 | 7.8 | 8.5 |
| 1983 | 9.6 | 6.8 | 9.0 |
| 1984 | 7.5 | 4.9 | 6.2 |
| 1985 | 7.2 | 4.4 | 5.4 |
| 1986 | 7.0 | 4.0 | 5.3 |
| 1987 | 6.2 | 3.4 | 4.5 |
| 1988 | 5.5 | 3.1 | 3.7 |
| 1989 | 5.3 | 3.9 | 4.1 |
| 1990 | 5.6 | 5.7 | 5.2 |
| 1991 | 6.9 | 8.0 | 7.6 |
| 1992 | 7.5 | 8.1 | 7.2 |
| 1993 | 6.9 | 6.8 | 7.9 |
| 1994 | 6.1 | 5.9 | 7.4 |
| 1995 | 5.6 | 5.4 | 5.7 |
| 1996 | 5.4 | 4.8 | 5.1 |
| 1997 | 4.9 | 4.4 | 5.4 |
| 1998 | 4.5 | 3.5 | 4.4 |
| 1999 | 4.2 | 3.3 | 4.1 |
| 2000 | 4.0 | 2.8 | 3.5 |
| 2001 | 4.7 | 3.7 | 3.9 |
| 2002 | 5.8 | 4.8 | 4.4 |
| 2003 | 6.0 | 5.4 | 5.0 |
| 2004 | 5.5 | 4.3 | 4.6 |
| 2005 | 5.1 | 4.7 | 4.8 |
| 2006 | 4.6 | 4.5 | 4.6 |
| 2007 | 4.6 | 4.5 | 4.6 |
| 2008 | 5.8 | 5.4 | 8.3 |
| 2009 | 9.3 | 8.3 | 8.0 |


