Employment, Top 50 Employers
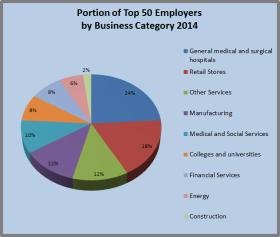
Top 50 Employers 2014

The rank of private sector employment by Maine firms varies with both long- and short-term trends in the economy. The table below is a snapshot of the fifty largest private employers in Maine in the first quarter of 2012 and the second quarter of 2014. The largest business category is “General Medical and Surgical Hospitals.” …

Economy, Labor History

Panel 1

People who have worked on farms, in forests, on the seas, in mills, factories and offices — all have contributed to the Maine economy over the past nearly four centuries.  In the twenty-first century more people are working in commercial, health, electronic, financial and other services than ever before. A perspective of where workers have…

Poverty

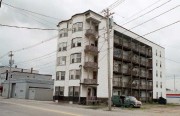
Tenement Housing Usually Serves Low-Income People (2002)

Official Poverty Levels by Family Size Size Income 1 $12,140 2 $16,460 3 $20,780 4 $25,100 5 $29,420 6 $33,740 7 $38,060 8 $42,380 – – – – – – – – – – For each additional family member, add $4,320. Standards for 2018 issued by the U.S. Department of Health and Human Services. The…

Codyville

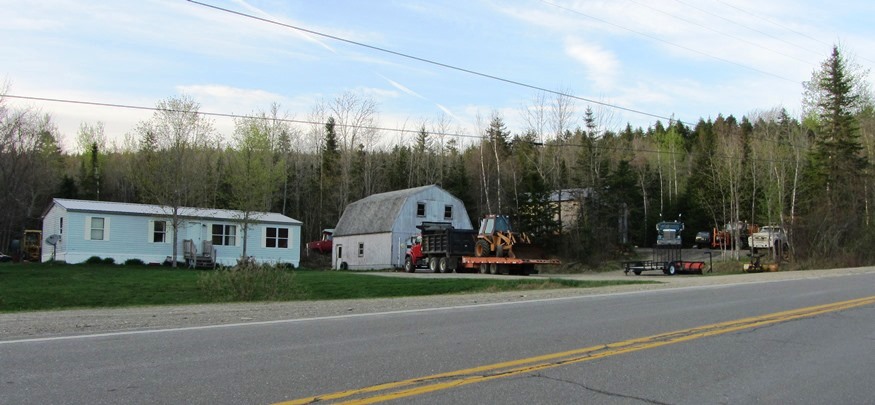
is a plantation in eastern Washington County organized in 1871. Recent population losses may threaten its ability to survive. Maine Route 6 links it to Vanceboro on the Canadian Border. This heavily forested area is subject to the “Eastern Interior Region Management Plan” of the Maine Department of Conservation. See photos.

Status of Women 1892

[pp. 13-17] LIST OF EMPLOYMENTS. Women were found engaged in the following employments. Artists. Art stores. Bazaars. Cigar stores. Crockery stores. Confectionery stores. Dry goods stores. Dry goods and notion stores. Dry goods and carpet stores. Dry and fancy goods stores. Drug stores. Drug and perfumery stores. Fancy goods stores. Fruit stores. Glove stores. Jewelry…

Employment by Industry

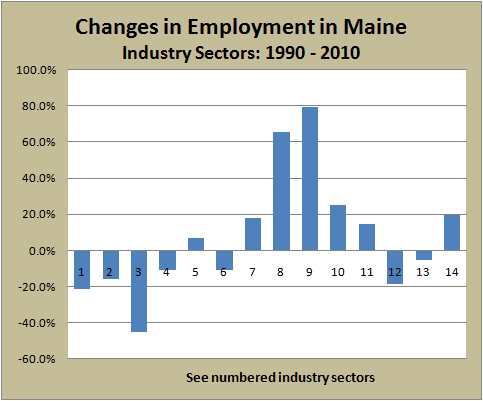
Change in Employment Sectors 1990-2010

In 1990 Trade (17.5%) and Manufacturing (17.4%) constituted the largest employment sectors in the Maine economy. By 2010, Manufacturing had faded to 8.6%, and the top two employment sectors were Trade (17%) and Education and Health Services (20.2%).  During the two decades, Manufacturing (No. 3 on the chart) had lost over 45% of its employees,…

Labor Force

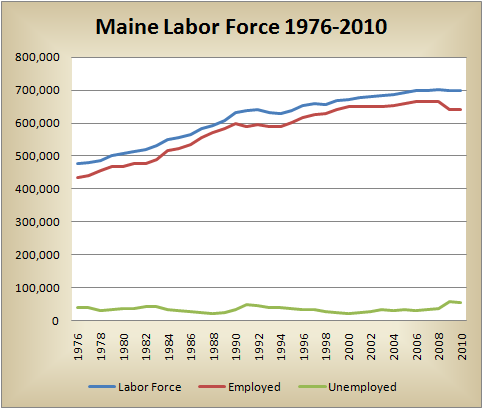
Chart of Maine Labor Force

The labor force is defined as the total of people employed and those who are unemployed and seeking employment. While growing in the long term, Maine’s total labor force actually contracts from time to time as people stop seeking employment. The recent rate of increase may be slowing as the population ages and in-migration of…

Economic Data

Gross Domestic Product by County County by Rank $Billions GDP $Billions % of Total $ GDP People % Total People GDP /Capita Rank /Capita Rank/ Capita Per Capita GDP 1 Cumberland $19.40 34.04% 293,557 21.93% $88.45 Cumberland 1 $88.45 2 York $7.40 12.98% 206,229 15.41% $48.03 Hancock 2 $54.82 3 Penobscot $6.00 10.53% 151,096 11.29%…

Unemployment

Unemployment Statistics 1969-2011

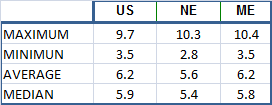
Average annual unemployment in Maine’s economy was consistently higher than the national average from 1969 through 1980. For the next decade, 1981 through 1990, the opposite was true! Since then, Maine’s annual unemployment rate has generally tracked the national rate, though usually a bit higher than the New England rate. Over the four decades, 1969-2010,…

Aroostook County

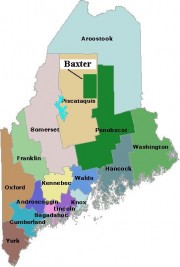
Map of Maine Counties and Baxter Park

the “rooftop of Maine,” John Steinbeck. This northernmost county, known as “the County,” is the state’s largest, established in 1839, during the “Aroostook War.” Famed for its potato growing, the County’s premiere crop has declined steadily, as has its population. Nevertheless, agriculture still dominates the County’s economy and its culture.