Historically low periwinkle harvests by commercial fishermen (averaging about 118,000 pounds per year) suddenly spiked in 1989 to 3.8 million pounds, then crashed to a level after 1993 of averaging about 616,000 pounds. The decade ending 2016 rebounded to an average of 852,041.
In a narrow range of 6 to 8 cents a pound from 1950 through 1970, the price per pound, began a long-term increase that now stands at about 90 cents per pound.
The University of Maine SeaGrant program notes the following:
The Department of Marine Resources has implemented a minimum size for periwinkles. More than 90% are landed in Washington County, where the resource experiences extra harvesting pressure during times of economic decline.
Periwinkles and whelks are pickled and sold locally as “wrinkles.” Most of the harvest is exported live to major US cities and Europe, where cooked meat is picked out of the shell with a pin, and to Asia where raw snails are a delicacy to be sucked out through a tiny hole ground in the shell.*
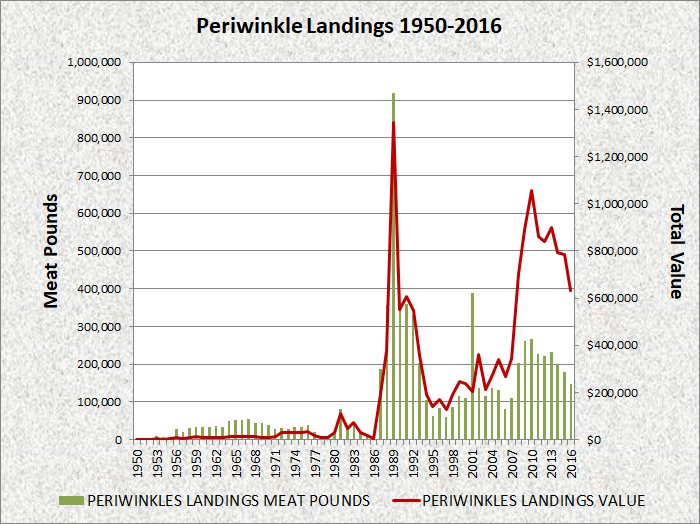
Periwinkle Landings 1950-2016

Periwinkles Price per Pound 1950-2016
| YEAR | WHOLE POUNDS | VALUE | PRICE/LB |
| 1950 | 13,344 | $1,035 | $0.08 |
| 1951 | 13,344 | $1,057 | $0.08 |
| 1952 | 19,599 | $1,473 | $0.08 |
| 1953 | 44,619 | $3,092 | $0.07 |
| 1954 | 23,352 | $1,767 | $0.08 |
| 1955 | 32,943 | $2,606 | $0.08 |
| 1956 | 111,339 | $8,118 | $0.07 |
| 1957 | 79,230 | $6,508 | $0.08 |
| 1958 | 127,602 | $10,584 | $0.08 |
| 1959 | 143,031 | $11,090 | $0.08 |
| 1960 | 133,440 | $10,022 | $0.08 |
| 1961 | 140,529 | $10,274 | $0.07 |
| 1962 | 145,533 | $10,674 | $0.07 |
| 1963 | 142,197 | $10,704 | $0.08 |
| 1964 | 200,552 | $12,886 | $0.06 |
| 1965 | 212,824 | $11,806 | $0.06 |
| 1966 | 215,531 | $13,209 | $0.06 |
| 1967 | 225,797 | $13,596 | $0.06 |
| 1968 | 186,057 | $11,240 | $0.06 |
| 1969 | 179,489 | $9,455 | $0.05 |
| 1970 | 165,053 | $9,608 | $0.06 |
| 1971 | 118,478 | $15,004 | $0.13 |
| 1972 | 123,778 | $29,952 | $0.24 |
| 1973 | 116,172 | $28,392 | $0.24 |
| 1974 | 141,605 | $31,515 | $0.22 |
| 1975 | 134,603 | $29,928 | $0.22 |
| 1976 | 159,957 | $35,770 | $0.22 |
| 1977 | 81,465 | $17,767 | $0.22 |
| 1978 | 28,861 | $6,782 | $0.23 |
| 1979 | 30,791 | $7,451 | $0.24 |
| 1980 | 97,570 | $28,090 | $0.29 |
| 1981 | 338,266 | $111,716 | $0.33 |
| 1982 | 147,647 | $48,850 | $0.33 |
| 1983 | 179,890 | $71,087 | $0.40 |
| 1984 | 77,745 | $28,034 | $0.36 |
| 1985 | 36,742 | $16,520 | $0.45 |
| 1986 | 13,344 | $5,012 | $0.38 |
| 1987 | 782,930 | $194,254 | $0.25 |
| 1988 | 1,486,618 | $379,571 | $0.26 |
| 1989 | 3,827,560 | $1,343,318 | $0.35 |
| 1990 | 1,446,794 | $550,119 | $0.38 |
| 1991 | 1,502,084 | $606,331 | $0.40 |
| 1992 | 1,374,565 | $546,038 | $0.40 |
| 1993 | 847,181 | $356,748 | $0.42 |
| 1994 | 432,612 | $190,719 | $0.44 |
| 1995 | 259,491 | $139,654 | $0.54 |
| 1996 | 348,203 | $168,851 | $0.48 |
| 1997 | 250,909 | $128,902 | $0.51 |
| 1998 | 361,606 | $190,384 | $0.53 |
| 1999 | 477,907 | $247,201 | $0.52 |
| 2000 | 461,915 | $236,901 | $0.51 |
| 2001 | 1,618,535 | $202,207 | $0.12 |
| 2002 | 567,833 | $359,664 | $0.63 |
| 2003 | 483,916 | $212,031 | $0.44 |
| 2004 | 381,929 | $277,909 | $0.73 |
| 2005 | 446,166 | $340,254 | $0.76 |
| 2006 | 339,151 | $266,979 | $0.79 |
| 2007 | 457,497 | $342,179 | $0.75 |
| 2008 | 844,799 | $703,950 | $0.83 |
| 2009 | 1,086,689 | $889,458 | $0.82 |
| 2010 | 1,105,981 | $1,054,250 | $0.95 |
| 2011 | 940,969 | $862,556 | $0.92 |
| 2012 | 928,981 | $841,201 | $0.91 |
| 2013 | 969,421 | $898,708 | $0.93 |
| 2014 | 827,291 | $794,577 | $0.96 |
| 2015 | 741,449 | $782,782 | $1.06 |
| 2016 | 617,336 | $634,246 | $1.03 |
Source: http://www.maine.gov/dmr/commercial-fishing/landings/documents/periwinkles.table.pdf (accessed January 20, 2018)
*http://www.seagrant.umaine.edu/maine-seafood-guide/periwinkles-and-whelks (accessed 9/26/12)