As the graphs below indicate, both violent and non-violent crime have been decreasing in frequency since 1980, with a slight increase since 2005. The number of crimes in 2013, compared to the 1980 figures, declined 22% for violent offenses and 36% for property offenses. See also Crime, Weapons.
The Maine Department of Public Safety summarizes reported crime through the department’s Uniform Crime Reporting Division. Offenses comprising the crime index are murder (Mu), rape (Ra), robbery (Ro), aggravated assault (Aa), burglary (Bu), larceny-theft (Lt), motor vehicle theft (MVt), and arson (Ar).
| —— Violent Crimes —— | ——– Property Crimes ——– | All Index | Violent Crimes | Property Crimes | |||||||
| Year | (Mu) | (Ra) | (Ro) | (Aa) | (Bu) | (Lt) | (MVt) | (Ar) | Total | Total | Total |
| 1980 | 32 | 145 | 345 | 1,618 | 13,275 | 31,055 | 2,455 | 994 | 49,919 | 2,140 | 47,779 |
| 1981 | 36 | 145 | 368 | 1,663 | 14,081 | 29,549 | 2,194 | 732 | 48,768 | 2,212 | 46,556 |
| 1982 | 24 | 151 | 344 | 1,324 | 11,850 | 27,843 | 2,156 | 533 | 44,225 | 1,843 | 42,382 |
| 1983 | 24 | 193 | 311 | 1,301 | 11,416 | 27,022 | 1,920 | 460 | 42,647 | 1,829 | 40,818 |
| 1984 | 20 | 155 | 305 | 1,352 | 10,266 | 26,810 | 1,866 | 366 | 41,140 | 1,832 | 39,308 |
| 1985 | 28 | 167 | 284 | 1,472 | 10,610 | 28,281 | 1,923 | 422 | 43,187 | 1,951 | 41,236 |
| 1986 | 22 | 174 | 328 | 1,205 | 9,467 | 27,550 | 1,927 | 398 | 41,071 | 1,729 | 39,342 |
| 1987 | 30 | 184 | 302 | 1,281 | 9,119 | 28,779 | 2,052 | 376 | 42,123 | 1,797 | 40,326 |
| 1988 | 37 | 225 | 312 | 1,289 | 9,862 | 29,041 | 2,470 | 310 | 43,546 | 1,863 | 41,683 |
| 1989 | 40 | 230 | 295 | 1,112 | 9,848 | 30,079 | 2,237 | 337 | 44,178 | 1,677 | 42,501 |
| 1990 | 29 | 187 | 316 | 1,316 | 10,663 | 28,648 | 2,092 | 427 | 43,678 | 1,848 | 41,830 |
| 1991 | 24 | 243 | 282 | 1,078 | 11,127 | 31,635 | 2,008 | 298 | 46,695 | 1,627 | 45,068 |
| 1992 | 25 | 298 | 291 | 1,001 | 10,061 | 29,604 | 1,755 | 286 | 43,321 | 1,615 | 41,706 |
| 1993 | 16 | 348 | 263 | 945 | 8,918 | 26,769 | 1,665 | 326 | 39,250 | 1,572 | 37,678 |
| 1994 | 28 | 315 | 277 | 978 | 8,915 | 28,138 | 1,756 | 281 | 40,688 | 1,598 | 39,090 |
| 1995 | 21 | 315 | 331 | 1,021 | 9,218 | 28,504 | 1,720 | 251 | 41,381 | 1,688 | 39,693 |
| 1996 | 25 | 260 | 292 | 976 | 9,303 | 29,557 | 1,776 | 288 | 42,477 | 1,553 | 40,924 |
| 1997 | 19 | 254 | 257 | 962 | 8,241 | 27,513 | 1,642 | 253 | 39,141 | 1,492 | 37,649 |
| 1998 | 26 | 229 | 263 | 1,051 | 8,286 | 26,387 | 1,513 | 202 | 37,957 | 1,569 | 36,388 |
| 1999 | 25 | 273 | 196 | 788 | 7,613 | 25,322 | 1,457 | 194 | 35,868 | 1,282 | 34,586 |
| 2000 | 11 | 318 | 246 | 812 | 6,759 | 23,808 | 1,317 | 196 | 33,470 | 1,390 | 32,080 |
| 2001 | 19 | 322 | 263 | 819 | 6,878 | 24,515 | 1,667 | 212 | 34,695 | 1,419 | 33,186 |
| 2002 | 14 | 391 | 269 | 728 | 6,944 | 24,496 | 1,418 | 174 | 34,434 | 1,402 | 33,032 |
| 2003 | 17 | 351 | 289 | 755 | 6,571 | 24,064 | 1,450 | 196 | 33,693 | 1,412 | 32,281 |
| 2004 | 19 | 313 | 288 | 728 | 6,344 | 24,087 | 1,305 | 192 | 33,276 | 1,348 | 31,928 |
| 2005 | 19 | 322 | 323 | 826 | 6,277 | 24,153 | 1,344 | 177 | 33,441 | 1,490 | 31,951 |
| 2006 | 21 | 340 | 383 | 780 | 6,776 | 25,161 | 1,340 | 193 | 36,994 | 1,524 | 33,470 |
| 2007 | 21 | 393 | 349 | 793 | 6,677 | 24,060 | 1,260 | 243 | 33,794 | 1,556 | 32,240 |
| 2008 | 31 | 373 | 332 | 813 | 6,516 | 24,582 | 1,173 | 188 | 34,008 | 1,549 | 32,459 |
| 2009 | 26 | 374 | 398 | 742 | 6,711 | 23,900 | 1,018 | 243 | 33,412 | 1,540 | 31,872 |
| 2010 | 24 | 389 | 416 | 760 | 7,343 | 24,490 | 985 | 245 | 34,652 | 1,589 | 33,063 |
| 2011 | 25 | 391 | 370 | 843 | 7,826 | 24,826 | 1,074 | 260 | 35,615 | 1,629 | 33,986 |
| 2012 | 24 | 368 | 421 | 803 | 7,429 | 24,812 | 990 | 226 | 35,073 | 1,616 | 33,457 |
| 2013 | 24 | 359 | 335 | 943 | 6,453 | 23,006 | 902 | 140 | 32,138 | 1,661 | 30,501 |
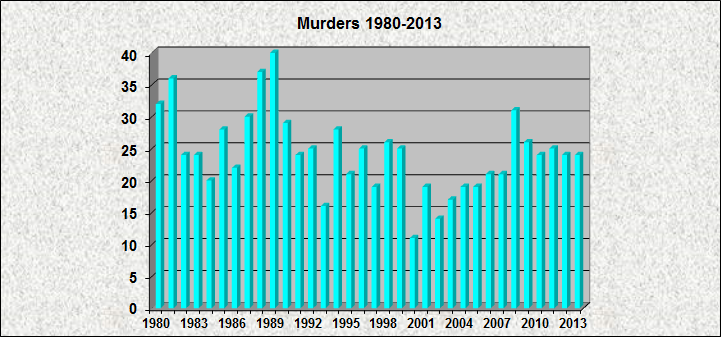
Murders 1980-2013
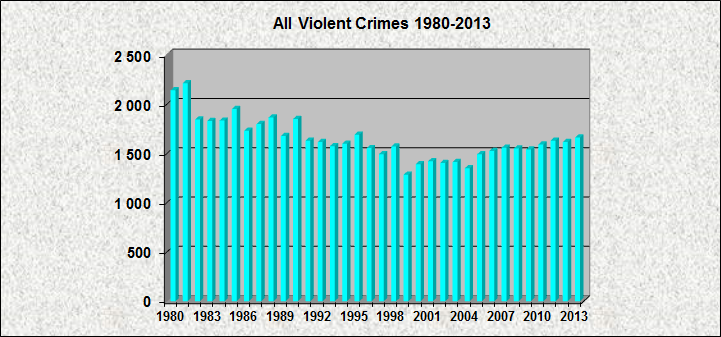
All Violent Crimes 1980-2013
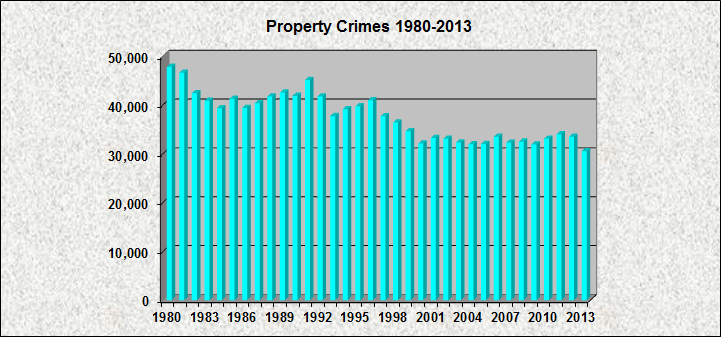
Property Crimes 1980-2013
Source: Maine Department of Public Safety. Crime in Maine (various years). Augusta, Me.