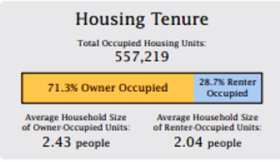
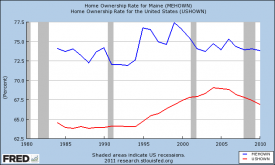
 Maine home ownership in 2010 was 73.8%, compared with 66.9% for the U.S. as a whole. It had dropped from 75.3% in 2006, just before the recession in the housing market. In 2000, the U.S. rate was 76.5 and Maine’s was 67.4. From 1984 throught 2010, Maine’s peak rate of home ownership was 77.4% in 1999, more than 10% above the national rate.
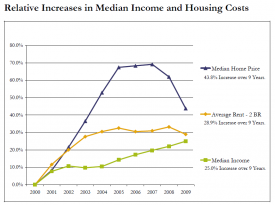 As the Maine State Housing Authority’s chart at left indicates, housing costs have been increasing faster than incomes. The vertical axis is an index showing how the values in later years compare to the 2000 values.
The Housing Authority tracks the “affordability” of home ownership by identifying the income needed to purchase a median-priced house in Maine. That is, a house the price of which is in the middle of all houses sold in the state for a given year.
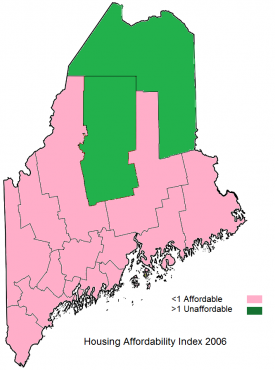
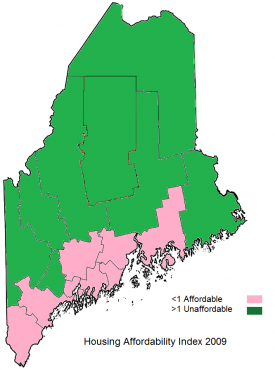
The “affordability index” for a county is simply the median income of the county divided by the income needed to buy a median priced home in that county. The median income means that half the population has incomes height than the median, and half have incomes lower than the median.
If the median income of a county is more than the income needed to buy, then the index is greater than 1.0. In 2006 only two counties, Aroostook and Somerset, had indexes above 1.0, meaning more than half their populations could afford a median-priced home. By 2009, with the drop in housing values, eight of Maine’s sixteen counties were in this position. See how these figures compare to the median value of owner-occupied housing units and vacancy rates.
| Area | Year | Afford-ability Index |
Median Home Price |
Median Income |
Income Needed: Median Home |
Price to Afford: Median Income |
Unable Afford Home Numb |
to Median Price -Percent |
| Maine | 2001 | 0.94 | $118,900 | $40,862 | $43,511 | $111,663 | 286,590 | -56.70% |
| 2002 | 0.89 | $133,500 | $42,029 | $47,302 | $118,618 | 319,824 | -60.30% | |
| 2003 | 0.81 | $150,000 | $41,645 | $51,400 | $121,532 | 332,378 | -61.70% | |
| 2004 | 0.73 | $168,000 | $41,929 | $57,592 | $122,310 | 357,732 | -66.00% | |
| 2005 | 0.70 | $184,000 | $43,370 | $61,648 | $129,445 | 372,491 | -68.00% | |
| 2006 | 0.73 | $185,000 | $44,488 | $61,270 | $134,329 | 369,128 | -66.50% | |
| 2007 | 0.74 | $185,900 | $45,438 | $61,568 | $137,198 | 369,172 | -65.70% | |
| 2008 | 0.79 | $17,800 | $46,321 | $58,951 | $139,864 | 350,239 | 62.60% | |
| 2009 | 0.90 | $158,000 | $47,445 | $52,937 | $141,608 | 313,046 | -56.40% | |
| Counties 2006 | ||||||||
| Androscoggin | 2006 | 0.77 | $155,000 | $42,126 | $54,473 | $119,865 | 28,466 | -62.90% |
| Aroostook | 2006 | 1.29 | $76,175 | $34,151 | $26,496 | $98,183 | 12,424 | -39.40% |
| Cumberland | 2006 | 0.68 | $238,250 | $53,255 | $78,225 | $162,200 | 81,290 | -71.30% |
| Franklin | 2006 | 0.89 | $124,750 | $36,766 | $41,465 | $110,614 | 6,948 | -56.30% |
| Hancock | 2006 | 0.69 | $195,000 | $42,675 | $62,178 | $133,836 | 16,143 | -68.20% |
| Kennebec | 2006 | 0.90 | $139,000 | $41,634 | $46,402 | $124,718 | 28,361 | -55.40% |
| Knox | 2006 | 0.71 | $200,000 | $45,623 | $63,916 | $142,760 | 12,018 | -67.90% |
| Lincoln | 2006 | 0.69 | $202,233 | $44,566 | $64,810 | $139,063 | 10,740 | -69.20% |
| Oxford | 2006 | 0.88 | $135,000 | $39,445 | $44,733 | $119,040 | 13,515 | -56.20% |
| Penobscot | 2006 | 0.89 | $134,000 | $40,188 | $45,133 | $119,321 | 34,137 | -55.80% |
| Piscataquis | 2006 | 0.92 | $108,667 | $32,553 | $35,555 | $99,490 | 4,213 | -54.40% |
| Sagadahoc | 2006 | 0.79 | $189,900 | $49,278 | $62,757 | $149,114 | 9,675 | -63.10% |
| Somerset | 2006 | 1.10 | $97,500 | $36,025 | $32,681 | $107,476 | 9,938 | -45.90% |
| Waldo | 2006 | 0.83 | $145,000 | $40,773 | $48,925 | $120,840 | 9,676 | -59.20% |
| Washington | 2006 | 0.73 | $120,000 | $29,913 | $40,988 | $87,576 | 9,246 | -63.90% |
| York | 2006 | 0.71 | $225,000 | $51,121 | $71,986 | $159,786 | 58,278 | -69.70% |
| Counties 2009 | ||||||||
| Androscoggin | 2009 | 1.04 | $128,000 | $45,878 | $44,151 | $133,008 | 21,969 | -48.30% |
| Aroostook | 2009 | 1.21 | $85,000 | $35,785 | $29,499 | $103,115 | 13,066 | -41.80% |
| Cumberland | 2009 | 0.82 | $210,000 | $57,540 | $70,058 | $172,477 | 70,806 | -61.90% |
| Franklin | 2009 | 1.00 | $115,500 | $38,944 | $38,897 | $115,639 | 6,283 | -50.30% |
| Hancock | 2009 | 0.85 | $164,500 | $45,237 | $53,074 | $140,209 | 13,721 | -58.30% |
| Kennebec | 2009 | 1.04 | $124,900 | $44,331 | $42,813 | $129,329 | 24,469 | -48.70% |
| Knox | 2009 | 0.84 | $175,000 | $48,242 | $57,774 | $146,126 | 10,540 | -59.90% |
| Lincoln | 2009 | 0.87 | $165,000 | $46,921 | $53,929 | $143,558 | 8,699 | -56.90% |
| Oxford | 2009 | 1.00 | $123,500 | $41,404 | $41,379 | $123,573 | 12,019 | -49.70% |
| Penobscot | 2009 | 1.03 | $121,000 | $42,300 | $41,118 | $124,481 | 30,576 | -48.90% |
| Piscataquis | 2009 | 1.43 | $74,250 | $35,678 | $24,976 | $106,066 | 2,731 | -35.90% |
| Sagadahoc | 2009 | 0.97 | $165,000 | $53,740 | $55,120 | $160,868 | 7,778 | -51.60% |
| Somerset | 2009 | 1.33 | $85,900 | $38,691 | $28,999 | $114,611 | 8,133 | -37.00% |
| Waldo | 2009 | 0.94 | $140,000 | $43,721 | $46,571 | $131,432 | 8,718 | -53.30% |
| Washington | 2009 | 1.13 | $82,750 | $32,200 | $28,486 | $93,538 | 6,399 | -44.70% |
| York | 2009 | 0.90 | $184,950 | $53,848 | $59,900 | $166,263 | 45,893 | -55.90% |
Sources:
Federal Reserve Bank of St. Louis http://research.stlouisfed.org/fred2/data/MEHOWN.txt (accessed August 27, 2011)
Maine State Housing Authority. http://www.mainehousing.org/docs/housing-facts—homeownership/2011/04/07/mainehomeownershipfacts2009.pdf (accessed August 27, 2011)
Additional resources
Affordable Housing For The Emerging Maine: The Report Of The Governor’s Task Force On Affordable Housing. Maine. Governor’s Task Force on Affordable Housing. Augusta, Me. The Task Force. 1988.
An Assessment Of Housing Data In Maine. Maine State Housing Authority. Augusta, Me. The Authority 1991.
Maine Interagency Task Force on Homelessness and Housing Opportunities. More…and More Needy: a Study of Maine’s Homeless Population. Augusta, Me.? The Task Force. 1997.
Maine State Housing Authority. http://www.mainehousing.org/
Maine State Housing Authority. Maine Housing Trends, 1950-1980. Augusta, Me. The Authority. 1984?
Maine State Planning Office. Municipal Household Projections 1900-1984. Augusta, Me. The Office.
Statewide Homeless Council and regional homeless councils. Maine’s Plan to End & Prevent Homelessness. Augusta, Me. ? The Council? 2008.
U.S. Census Bureau. http://www.census.gov/hhes/www/housing.html


