While still below the highs of the 1950s and early 1960s, Atlantic herring landings by commercial fishermen have been relatively consistent since the early 1990s in a range of 75 to 95 million pounds.
More Videos!
Since 2002 the total value of the landings has increased substantially. In the same period herring was returning an increasing price per pound, more than doubling 2001 to 2011.
According to the National Oceanic and Atmospheric Administration (NOAA),*
Atlantic herring has recovered substantially from the very low levels of the 1970s and is now harvested sustainably. The Atlantic herring fishery is extremely valuable to the economy in the U.S. Northeast. Herring are sold frozen, salted, or canned as sardines in both U.S. and international markets and provide affordable bait to lobster, blue crab, and tuna fishermen. Herring are managed under “annual catch limits,” which limit the amount of herring fishermen are allowed to catch in a year to ensure the resource isn’t over harvested again and that this important fishery can continue for generations to come.
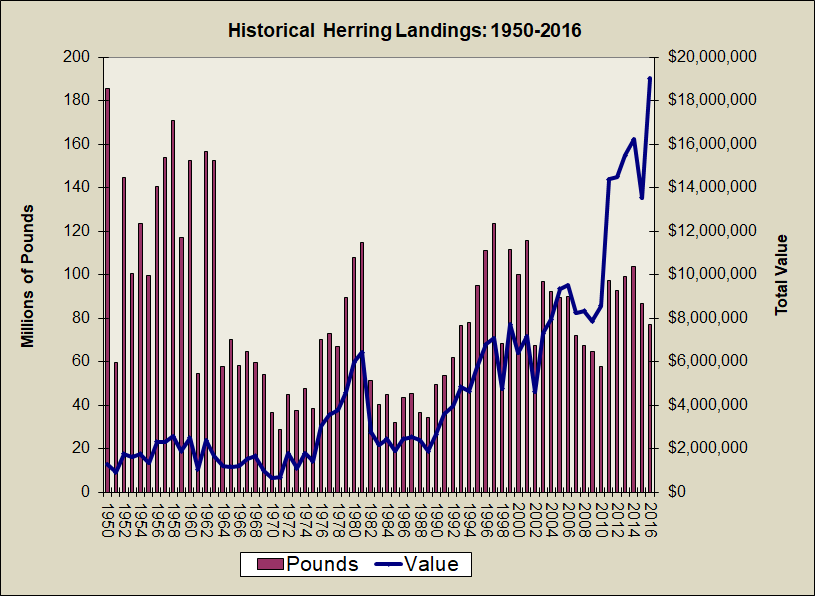
Herring Landings 1950-2016
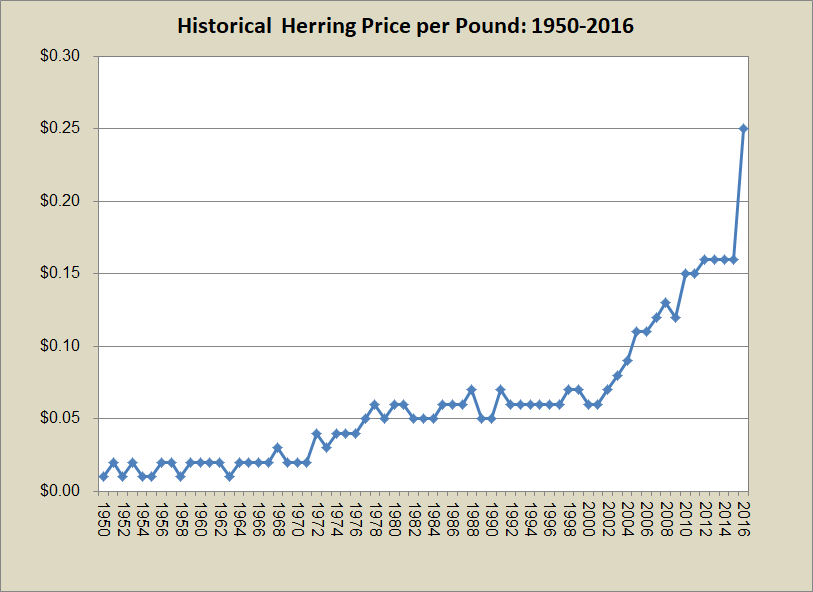
Herring Price per Pound 1950-2016
| YEAR | POUNDS | VALUE | PRICE/LB |
| 1950 | 185,481,500 | $1,269,467 | $0.01 |
| 1951 | 59,738,100 | $913,689 | $0.02 |
| 1952 | 144,661,100 | $1,752,497 | $0.01 |
| 1953 | 100,587,500 | $1,621,170 | $0.02 |
| 1954 | 123,602,000 | $1,769,516 | $0.01 |
| 1955 | 99,415,800 | $1,352,969 | $0.01 |
| 1956 | 140,472,300 | $2,299,320 | $0.02 |
| 1957 | 153,621,100 | $2,312,056 | $0.02 |
| 1958 | 170,977,300 | $2,562,805 | $0.01 |
| 1959 | 117,149,800 | $1,880,121 | $0.02 |
| 1960 | 152,327,300 | $2,486,250 | $0.02 |
| 1961 | 54,462,600 | $1,035,522 | $0.02 |
| 1962 | 156,699,400 | $2,374,552 | $0.02 |
| 1963 | 152,316,800 | $1,649,042 | $0.01 |
| 1964 | 57,660,641 | $1,209,581 | $0.02 |
| 1965 | 70,179,523 | $1,167,683 | $0.02 |
| 1966 | 58,298,675 | $1,208,693 | $0.02 |
| 1967 | 64,599,660 | $1,537,697 | $0.02 |
| 1968 | 59,703,321 | $1,668,443 | $0.03 |
| 1969 | 54,213,635 | $967,657 | $0.02 |
| 1970 | 36,593,185 | $653,114 | $0.02 |
| 1971 | 28,570,370 | $687,346 | $0.02 |
| 1972 | 44,689,750 | $1,787,072 | $0.04 |
| 1973 | 37,384,405 | $1,095,072 | $0.03 |
| 1974 | 47,397,980 | $1,792,546 | $0.04 |
| 1975 | 38,247,475 | $1,422,695 | $0.04 |
| 1976 | 70,233,465 | $3,053,366 | $0.04 |
| 1977 | 73,049,915 | $3,545,465 | $0.05 |
| 1978 | 66,895,150 | $3,781,612 | $0.06 |
| 1979 | 89,375,145 | $4,583,641 | $0.05 |
| 1980 | 107,823,120 | $5,976,744 | $0.06 |
| 1981 | 114,592,828 | $6,435,366 | $0.06 |
| 1982 | 51,160,800 | $2,758,156 | $0.05 |
| 1983 | 40,036,938 | $2,171,224 | $0.05 |
| 1984 | 44,960,437 | $2,449,934 | $0.05 |
| 1985 | 32,120,729 | $1,905,771 | $0.06 |
| 1986 | 43,644,838 | $2,440,200 | $0.06 |
| 1987 | 45,158,678 | $2,551,476 | $0.06 |
| 1988 | 36,443,512 | $2,368,897 | $0.07 |
| 1989 | 34,446,305 | $1,882,496 | $0.05 |
| 1990 | 49,391,482 | $2,665,381 | $0.05 |
| 1991 | 53,630,630 | $3,601,524 | $0.07 |
| 1992 | 61,835,897 | $3,947,739 | $0.06 |
| 1993 | 76,608,916 | $4,832,917 | $0.06 |
| 1994 | 77,880,630 | $4,642,750 | $0.06 |
| 1995 | 94,853,634 | $5,760,054 | $0.06 |
| 1996 | 111,016,104 | $6,804,505 | $0.06 |
| 1997 | 123,236,252 | $7,075,316 | $0.06 |
| 1998 | 68,255,041 | $4,746,242 | $0.07 |
| 1999 | 111,415,907 | $7,710,270 | $0.07 |
| 2000 | 100,096,801 | $6,400,254 | $0.06 |
| 2001 | 115,824,675 | $7,164,559 | $0.06 |
| 2002 | 67,168,589 | $6,448,964 | $0.07 |
| 2003 | 96,680,581 | $7,296,176 | $0.08 |
| 2004 | 92,134,922 | $7,942,709 | $0.09 |
| 2005 | 89,339,497 | $9,341,079 | $0.11 |
| 2006 | 89,797,819 | $9,499,679 | $0.11 |
| 2007 | 71,750,312 | $8,250,463 | $0.12 |
| 2008 | 67,482,579 | $8,327,328 | $0.13 |
| 2009 | 64,605,734 | $7,850,007 | $0.12 |
| 2010 | 57,500,777 | $8,572,391 | $0.15 |
| 2011 | 970,53,021 | $14,372,011 | $0.15 |
| 2012 | 92,527,533 | $14,483,090 | $0.16 |
| 2013 | 98,858,907 | $15,492,024 | $0.16 |
| 2014 | 103,529,863 | $16,211,924 | $0.16 |
| 2015 | 86,485,073 | $13,533,469 | $0.16 |
| 2016 | 77,225,524 | $19,019,337 | $0.25 |
Source: http://www.maine.gov/dmr/commercial-fishing/landings/documents/herring.table.pdf (accesssed January 28, 2018)
*NOAA. U.S. Fish Facts. Atlantic Herring. (accessed 9/21/2012)