After declining in the 1950’s and 1960’s, the landings of cusk by commercial fishermen rebounded, reaching a peak in 1985. After another short decline, another peak appeared in 1993, followed by declining landings ever since.
As the landings declined, the price per pound has increases, reaching more that $1.00 for the first time in 2008.
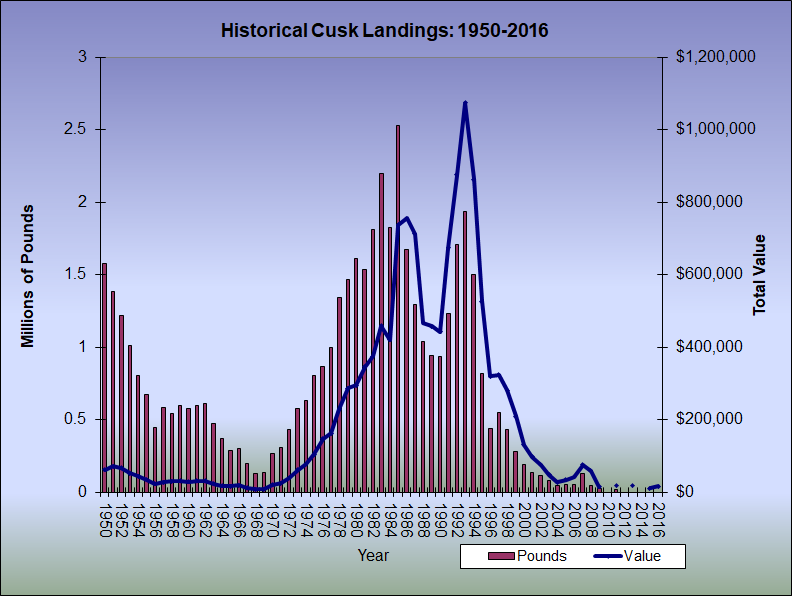
Cusk Landings 1950-2016
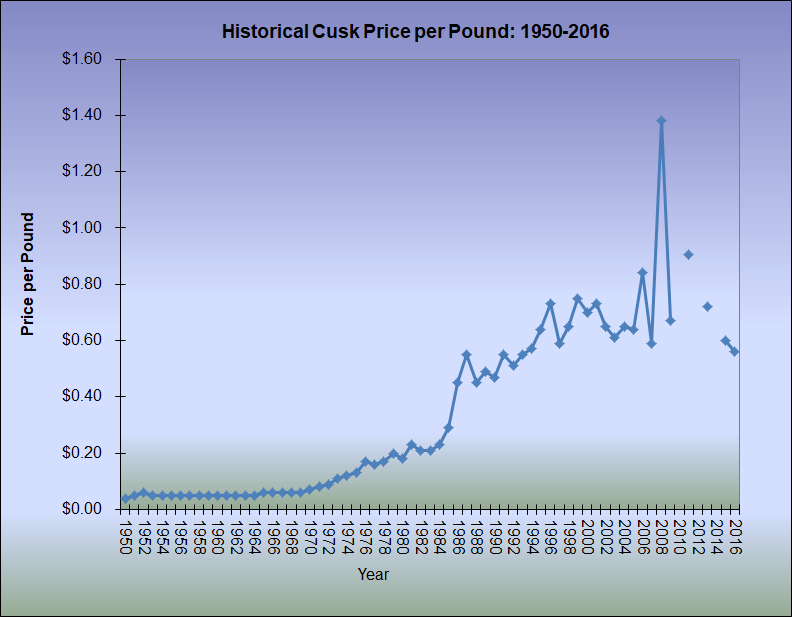
Cusk Price per Pound 1950-2016
| YEAR | POUNDS | POUNDS (millions) | VALUE | PRICE/LB |
| 1950 | 1,576,700 | 1.5767 | $61,081 | $0.04 |
| 1951 | 1,381,600 | 1.3816 | $70,804 | $0.05 |
| 1952 | 1,215,400 | 1.2154 | $67,402 | $0.06 |
| 1953 | 1,010,400 | 1.0104 | $51,082 | $0.05 |
| 1954 | 802,400 | 0.8024 | $43,552 | $0.05 |
| 1955 | 673,200 | 0.6732 | $34,065 | $0.05 |
| 1956 | 442,200 | 0.4422 | $23,213 | $0.05 |
| 1957 | 584,100 | 0.5841 | $26,808 | $0.05 |
| 1958 | 542,100 | 0.5421 | $29,186 | $0.05 |
| 1959 | 595,800 | 0.5958 | $30,703 | $0.05 |
| 1960 | 578,200 | 0.5782 | $27,869 | $0.05 |
| 1961 | 599,400 | 0.5994 | $31,245 | $0.05 |
| 1962 | 609,300 | 0.6093 | $31,068 | $0.05 |
| 1963 | 469,500 | 0.4695 | $23,256 | $0.05 |
| 1964 | 370,009 | 0.3700 | $17,807 | $0.05 |
| 1965 | 285,585 | 0.2856 | $16,064 | $0.06 |
| 1966 | 303,032 | 0.3030 | $18,579 | $0.06 |
| 1967 | 193,685 | 0.1937 | $11,493 | $0.06 |
| 1968 | 130,601 | 0.1306 | $7,421 | $0.06 |
| 1969 | 135,042 | 0.1350 | $8,108 | $0.06 |
| 1970 | 265,796 | 0.2658 | $19,389 | $0.07 |
| 1971 | 309,325 | 0.3093 | $23,480 | $0.08 |
| 1972 | 431,931 | 0.4319 | $39,076 | $0.09 |
| 1973 | 577,701 | 0.5777 | $61,213 | $0.11 |
| 1974 | 632,196 | 0.6322 | $76,498 | $0.12 |
| 1975 | 801,263 | 0.8013 | $104,463 | $0.13 |
| 1976 | 862,122 | 0.8621 | $146,919 | $0.17 |
| 1977 | 999,660 | 0.9997 | $162,428 | $0.16 |
| 1978 | 1,340,754 | 1.3408 | $228,278 | $0.17 |
| 1979 | 1,465,739 | 1.4657 | $285,886 | $0.20 |
| 1980 | 1,607,704 | 1.6077 | $294,792 | $0.18 |
| 1981 | 1,534,456 | 1.5345 | $345,903 | $0.23 |
| 1982 | 1,808,153 | 1.8082 | $374,515 | $0.21 |
| 1983 | 2,194,165 | 2.1942 | $458,018 | $0.21 |
| 1984 | 1,825,810 | 1.8258 | $420,284 | $0.23 |
| 1985 | 2,528,135 | 2.5281 | $737,097 | $0.29 |
| 1986 | 1,671,764 | 1.6718 | $755,360 | $0.45 |
| 1987 | 1,296,544 | 1.2965 | $712,653 | $0.55 |
| 1988 | 1,038,705 | 1.0387 | $466,426 | $0.45 |
| 1989 | 939,618 | 0.9396 | $456,563 | $0.49 |
| 1990 | 932,328 | 0.9323 | $442,127 | $0.47 |
| 1991 | 1,228,670 | 1.2287 | $673,464 | $0.55 |
| 1992 | 1,706,516 | 1.7065 | $874,684 | $0.51 |
| 1993 | 1,936,567 | 1.9366 | $1,073,995 | $0.55 |
| 1994 | 1,501,696 | 1.5017 | $863,144 | $0.57 |
| 1995 | 820,599 | 0.8206 | $525,900 | $0.64 |
| 1996 | 436,846 | 0.4368 | $319,183 | $0.73 |
| 1997 | 548,591 | 0.5487 | $323,731 | $0.59 |
| 1998 | 434,018 | 0.4340 | $281,120 | $0.65 |
| 1999 | 278,923 | 0.2789 | $209,378 | $0.75 |
| 2000 | 187,767 | 0.1878 | $130,641 | $0.70 |
| 2001 | 133,124 | 0.1331 | $97,734 | $0.73 |
| 2002 | 114,408 | 0.1144 | $74,497 | $0.65 |
| 2003 | 78,457 | 0.0785 | $47,698 | $0.61 |
| 2004 | 41,434 | 0.0414 | $27,001 | $0.65 |
| 2005 | 53,098 | 0.0531 | $33,822 | $0.64 |
| 2006 | 49,180 | 0.0492 | $41,405 | $0.84 |
| 2007 | 128,844 | 0.1288 | $75,483 | $0.59 |
| 2008 | 42,116 | 0.0421 | $58,272 | $1.38 |
| 2009 | 20,910 | 0.0209 | $14,023 | $0.67 |
| 2010 | No data available | |||
| 2011 | 18,276 | 0.0183 | $16,559 | $0.91 |
| 2012 | No data available | |||
| 2013 | 24,564 | 0.0246 | $17,618 | $0.72 |
| 2014 | No data available | |||
| 2015 | 18,351 | 0.0184 | $10,962 | $0.60 |
| 2016 | 27,145 | 0.0271 | $15,252 | $0.56 |
Source: http://www.maine.gov/dmr/commercial-fishing/landings/documents/cusk.table.pdf (accessed January 26, 2018)