The amount and value of cod landngs by commercial fishermen spiked in 1991 to over 21 million pounds and over $16 million in total value. Since then landings have dropped as sharply as they had increased in 1989 and 1990.
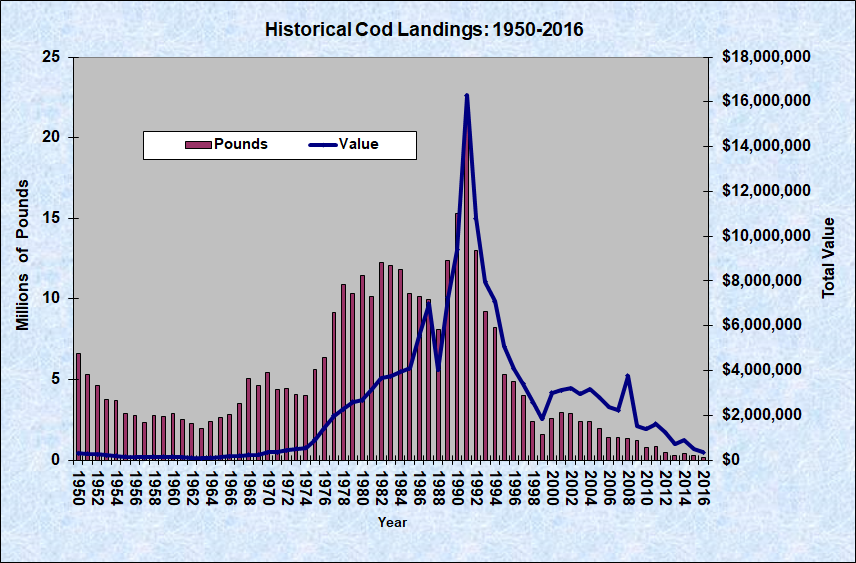
Atlantic Cod Historical Landings 1950-2016
| YEAR | LIVE POUNDS |
POUNDS (millions) | VALUE | PRICE/LB |
| 1950 | 6,613,000 | 6.6 | $304,150 | $0.05 |
| 1951 | 5,292,800 | 5.3 | $289,632 | $0.05 |
| 1952 | 4,614,500 | 4.6 | $256,454 | $0.06 |
| 1953 | 3,769,100 | 3.8 | $213,921 | $0.06 |
| 1954 | 3,688,900 | 3.7 | $195,077 | $0.05 |
| 1955 | 2,863,200 | 2.9 | $146,214 | $0.05 |
| 1956 | 2,746,200 | 2.7 | $133,730 | $0.05 |
| 1957 | 2,352,400 | 2.4 | $122,732 | $0.05 |
| 1958 | 2,735,400 | 2.7 | $150,074 | $0.05 |
| 1959 | 2,694,000 | 2.7 | $144,403 | $0.05 |
| 1960 | 2,897,200 | 2.9 | $144,470 | $0.05 |
| 1961 | 2,506,500 | 2.5 | $124,007 | $0.05 |
| 1962 | 2,260,000 | 2.3 | $107,384 | $0.05 |
| 1963 | 1,960,200 | 2.0 | $87,644 | $0.04 |
| 1964 | 2,394,246 | 2.4 | $107,302 | $0.04 |
| 1965 | 2,641,683 | 2.6 | $129,719 | $0.05 |
| 1966 | 2,802,362 | 2.8 | $176,295 | $0.06 |
| 1967 | 3,495,513 | 3.5 | $187,564 | $0.05 |
| 1968 | 5,036,606 | 5.0 | $235,179 | $0.05 |
| 1969 | 4,616,709 | 4.6 | $237,851 | $0.05 |
| 1970 | 5,426,597 | 5.4 | $356,915 | $0.07 |
| 1971 | 4,379,488 | 4.4 | $335,212 | $0.08 |
| 1972 | 4,432,288 | 4.4 | $436,649 | $0.10 |
| 1973 | 4,034,894 | 4.0 | $497,687 | $0.12 |
| 1974 | 4,003,672 | 4.0 | $541,414 | $0.14 |
| 1975 | 5,594,578 | 5.6 | $910,725 | $0.16 |
| 1976 | 6,366,673 | 6.4 | $1,429,263 | $0.22 |
| 1977 | 9,125,373 | 9.1 | $1,974,989 | $0.22 |
| 1978 | 10,886,020 | 10.9 | $2,263,753 | $0.21 |
| 1979 | 10,330,200 | 10.3 | $2,591,490 | $0.25 |
| 1980 | 11,441,058 | 11.4 | $2,659,426 | $0.23 |
| 1981 | 10,146,371 | 10.1 | $3,169,504 | $0.31 |
| 1982 | 12,251,802 | 12.3 | $3,658,222 | $0.30 |
| 1983 | 12,083,116 | 12.1 | $3,736,262 | $0.31 |
| 1984 | 11,794,465 | 11.8 | $3,943,350 | $0.33 |
| 1985 | 10,352,939 | 10.4 | $4,095,390 | $0.40 |
| 1986 | 10,154,740 | 10.2 | $5,526,283 | $0.54 |
| 1987 | 9,935,134 | 9.9 | $6,989,634 | $0.70 |
| 1988 | 8,104,717 | 8.1 | $4,033,956 | $0.50 |
| 1989 | 12,395,874 | 12.4 | $7,253,087 | $0.59 |
| 1990 | 15,276,501 | 15.3 | $9,388,134 | $0.61 |
| 1991 | 21,179,886 | 21.2 | $16,285,661 | $0.77 |
| 1992 | 12,995,190 | 13.0 | $10,789,171 | $0.83 |
| 1993 | 9,217,757 | 9.2 | $7,963,623 | $0.86 |
| 1994 | 8,250,246 | 8.3 | $7,079,548 | $0.86 |
| 1995 | 5,323,648 | 5.3 | $5,087,070 | $0.96 |
| 1996 | 4,864,337 | 4.9 | $4,078,101 | $0.84 |
| 1997 | 3,983,734 | 4.0 | $3,413,268 | $0.86 |
| 1998 | 2,400,124 | 2.4 | $2,582,965 | $1.08 |
| 1999 | 1,573,694 | 1.6 | $1,851,678 | $1.18 |
| 2000 | 2,602,240 | 2.6 | $2,994,368 | $1.15 |
| 2001 | 2,941,934 | 2.9 | $3,114,399 | $1.06 |
| 2002 | 2,904,089 | 2.9 | $3,203,755 | $1.10 |
| 2003 | 2,386,655 | 2.4 | $2,954,969 | $1.24 |
| 2004 | 2,371,787 | 2.4 | $3,158,650 | $1.33 |
| 2005 | 1,952,246 | 2.0 | $2,797,076 | $1.43 |
| 2006 | 1,419,031 | 1.4 | $2,369,772 | $1.66 |
| 2007 | 1,371,629 | 1.4 | $2,214,758 | $1.61 |
| 2008 | 1,324,467 | 1.3 | $3,769,248 | $2.85 |
| 2009 | 1,238,893 | 1.2 | $1,534,862 | $1.24 |
| 2010 | 748,130 | 0.7 | $1,388,705 | $1.86 |
| 2011 | 814,075 | 0.8 | $1,617,475 | $1.99 |
| 2012 | 492,714 | 0.5 | $1,234,108 | $2.50 |
| 2013 | 286,299 | 0.3 | $736,154 | $2.57 |
| 2014 | 404,122 | 0.4 | $884,372 | $2.19 |
| 2015 | 254,596 | 0.3 | $254,596 | $1.95 |
| 2016 | 166,082 | 0.2
|
$341,502 | $2.06 |
Source: Maine. Department of Marine Resources.
http://www.maine.gov/dmr/commercial-fishing/landings/documents/cod.table.pdf (accessed January 25, 2018)