Prior to the mid-1970’s, blue mussel harvests in commercial fishing were relatively low. Since then harvests appear to follow cycles, with higher yields in the late 1980’s, the mid-1990’s and the mid-2000’s. Higher total values followed a similar trend. “Whole pounds” in the table below refers to mussels in the shell, as does “price/lb.” Mussel meat averages about 17% of the “whole pound” weight.
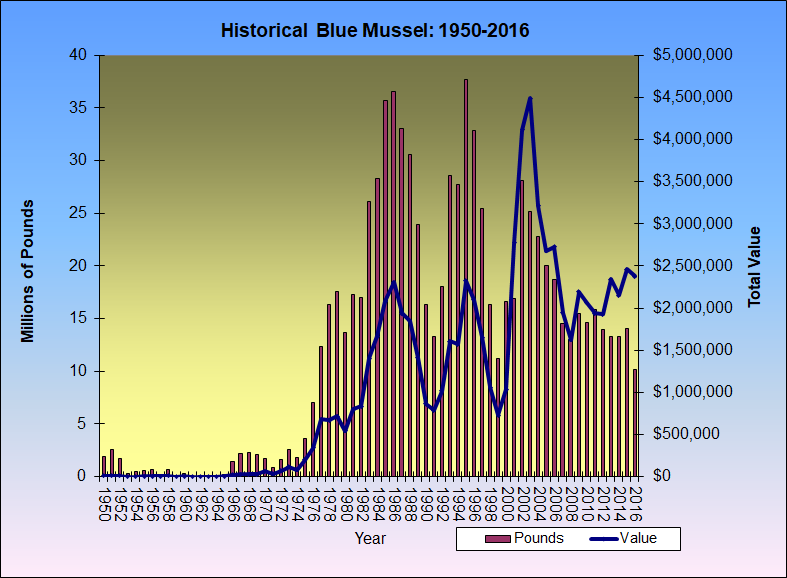
Blue Mussels Historical Landings 1950-2016
| YEAR | WHOLE POUNDS | POUNDS (millions) | VALUE | PRICE/LB |
| 1950 | 1,905,086 | 1.9051 | $11,370 | $0.03 |
| 1951 | 2,620,006 | 2.62 | $13,472 | $0.03 |
| 1952 | 1,685,336 | 1.6853 | $8,725 | $0.03 |
| 1953 | 301,204 | 0.3012 | $1,301 | $0.03 |
| 1954 | 477,004 | 0.477 | $2,048 | $0.03 |
| 1955 | 612,956 | 0.613 | $2,829 | $0.03 |
| 1956 | 713,162 | 0.7132 | $2,170 | $0.02 |
| 1957 | 227,368 | 0.2274 | $4,547 | $0.12 |
| 1958 | 705,544 | 0.7055 | $9,093 | $0.08 |
| 1959 | 141,226 | 0.1412 | $1,705 | $0.07 |
| 1960 | 291,828 | 0.2918 | $2,989 | $0.06 |
| 1961 | 12,892 | 0.0129 | $92 | $0.04 |
| 1962 | 42,778 | 0.0428 | $750 | $0.10 |
| 1963 | 119,544 | 0.1195 | $1,407 | $0.07 |
| 1964 | 90,303 | 0.0903 | $1,024 | $0.07 |
| 1965 | 185,909 | 0.1859 | $3,025 | $0.10 |
| 1966 | 1,405,164 | 1.4052 | $20,364 | $0.08 |
| 1967 | 2,172,320 | 2.1723 | $31,473 | $0.08 |
| 1968 | 2,281,896 | 2.2819 | $30,978 | $0.08 |
| 1969 | 2,068,170 | 2.0682 | $28,625 | $0.08 |
| 1970 | 1,764,551 | 1.7646 | $64,431 | $0.21 |
| 1971 | 880,219 | 0.8802 | $35,051 | $0.23 |
| 1972 | 1,645,136 | 1.6451 | $70,826 | $0.25 |
| 1973 | 2,575,406 | 2.5754 | $116,000 | $0.26 |
| 1974 | 1,806,802 | 1.8068 | $82,626 | $0.27 |
| 1975 | 3,588,348 | 3.5883 | $198,036 | $0.32 |
| 1976 | 7,050,717 | 7.0507 | $344,424 | $0.29 |
| 1977 | 12,380,527 | 12.3805 | $680,309 | $0.32 |
| 1978 | 16,381,730 | 16.3817 | $670,468 | $0.24 |
| 1979 | 17,582,766 | 17.5828 | $716,128 | $0.24 |
| 1980 | 13,662,807 | 13.6628 | $546,415 | $0.23 |
| 1981 | 17,299,359 | 17.2994 | $799,906 | $0.27 |
| 1982 | 16,987,583 | 16.9876 | $834,781 | $0.29 |
| 1983 | 26,075,271 | 26.0753 | $1,407,883 | $0.32 |
| 1984 | 28,267,404 | 28.2674 | $1,668,413 | $0.35 |
| 1985 | 35,687,300 | 35.6873 | $2,079,349 | $0.34 |
| 1986 | 36,573,291 | 36.5733 | $2,306,662 | $0.37 |
| 1987 | 33,062,636 | 33.0626 | $1,940,673 | $0.34 |
| 1988 | 30,618,137 | 30.6181 | $1,848,601 | $0.35 |
| 1989 | 23,946,685 | 23.9467 | $1,408,491 | $0.34 |
| 1990 | 16,329,623 | 16.3296 | $865,895 | $0.31 |
| 1991 | 13,278,748 | 13.2787 | $789,667 | $0.35 |
| 1992 | 18,086,890 | 18.0869 | $1,020,859 | $0.33 |
| 1993 | 28,549,826 | 28.5498 | $1,607,749 | $0.33 |
| 1994 | 27,732,503 | 27.7325 | $1,572,428 | $0.33 |
| 1995 | 37,675,194 | 37.6752 | $2,321,533 | $0.36 |
| 1996 | 32,887,357 | 32.8874 | $2,099,075 | $0.37 |
| 1997 | 25,479,632 | 25.4796 | $1,652,302 | $0.38 |
| 1998 | 16,379,444 | 16.3794 | $1,061,195 | $0.38 |
| 1999 | 11,202,328 | 11.2023 | $728,901 | $0.38 |
| 2000 | 16,628,863 | 16.6289 | $1,037,224 | $0.37 |
| 2001 | 16,885,930 | 16.8859 | $2,774,524 | $0.96 |
| 2002 | 28,088,685 | 28.0887 | $4,116,530 | $0.86 |
| 2003 | 25,123,338 | 25.1233 | $4,487,473 | $1.05 |
| 2004 | 22,754,462 | 22.7545 | $3,216,992 | $0.83 |
| 2005 | 20,012,404 | 20.0124 | $2,680,245 | $0.78 |
| 2006 | 18,756,510 | 18.7565 | $2,728,628 | $0.85 |
| 2007 | 14,526,646 | 14.5266 | $1,943,164 | $0.78 |
| 2008 | 13,008,281 | 13.0083 | $1,622,239 | $0.12 |
| 2009 | 15,503,462 | 15.5035 | $2,191,711 | $0.14 |
| 2010 | 14,671,387 | 14.6714 | $2,064,427 | $0.14 |
| 2011 | 15,831,725 | 15.8317 | $1,939,960 | $0.12 |
| 2012 | 13,952,165 | 13.9522 | $1,929,834 | $0.14 |
| 2013 | 13,336,775 | 13.3368 | $2,341,271 | $0.18 |
| 2014 | 13,300,428 | 13.3004 | $2,152,708 | $0.16 |
| 2015 | 14,068,742 | 14.0687 | $2,457,919 | $0.17 |
| 2016 | 10,209,583 | 10.2016 | $1,740,884 | $0.23 |
2016 landings are preliminary and landings in weight of meats (excluding the shell)
Source: Maine. Department of Marine Resources. http://www.maine.gov/dmr/commercial-fishing/landings/documents/bluemussel.table.pdf (accessed January 25, 2018)